Beyond merely assigning numerical values to products, pricing serves as a strategic tool that can profoundly influence a company’s profitability. An exceptionally effective approach in this regard is incorporating retail pricing analytics.
Through the utilization of data and advanced analytics methodologies, retailers can refine their pricing strategies.
This helps them attract a larger customer base, enhancing sales, and ultimately elevating their overall profitability.
Who This Article Is For: Mastering Pricing Analytics for Your Role
This deep dive into retail pricing analytics is specifically designed for the professionals who own pricing decisions every day. If you fall into any of these categories, the following sections are your essential playbook:
| Role | Primary Focus | What You’ll Gain |
|---|---|---|
| Pricing Managers | Setting and optimizing price points across categories | Advanced models for elasticity, stock-aware pricing, and competitive response frameworks |
| Category Leads / Merchandisers | Managing product assortment and profitability | Insights on how pricing drives category performance, inventory turns, and margin health |
| Ecommerce Operations | Day-to-day management of online channels | Practical frameworks for when to reprice, how to monitor competition, and what data matters |
| Revenue Analysts | Data modeling and performance reporting | Technical guidance on required data inputs, analytics cadence, and decision triggers |
| Finance / FP&A | Margin protection and profit optimization | Understanding the trade-offs between promotional lift and contribution margin erosion |
| Brand Owners | Overall business strategy and brand positioning | How pricing analytics protects brand value while driving profitable growth |
Whether you’re optimizing thousands of SKUs across multiple marketplaces or fine-tuning pricing for a premium product line, this guide provides the frameworks and insights you need to make data-driven pricing decisions that protect margins and drive revenue.
What is Pricing Analytics? Definition and Core Concepts
Pricing Analytics Definition: The systematic process of collecting, analyzing, and acting on pricing data to optimize revenue and profit margins. It combines historical sales data, competitor pricing, market demand, and customer behavior to inform strategic pricing decisions.
Key Components of Pricing Analytics:
- Competitive Intelligence: Monitoring competitor pricing strategies in real-time
- Descriptive Analytics: Understanding what happened with past pricing strategies
- Predictive Analytics: Forecasting how price changes will impact future demand
- Prescriptive Analytics: Recommending optimal pricing actions
How Pricing Analytics Can Boost Profits
Examining pricing trends, market demand, competition, and customer behavior constitutes the essence of pricing analytics.
The utilization of retail pricing data offers retailers valuable avenues to elevate their profitability through the following strategies:
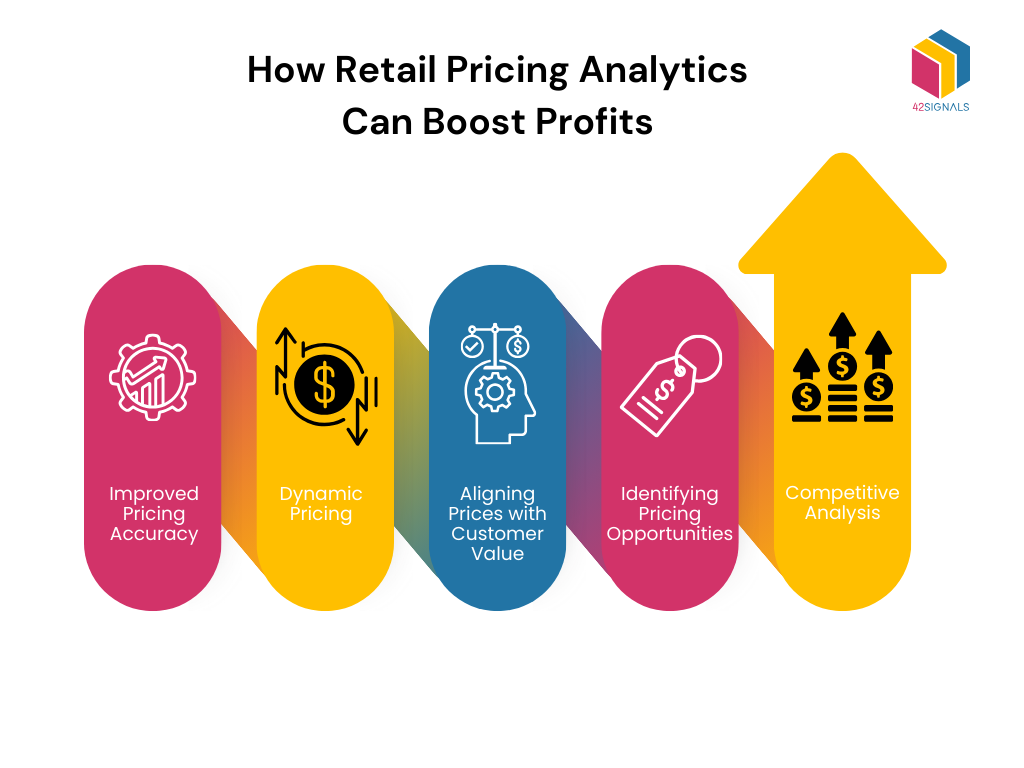
Improved Pricing Accuracy
Historical Sales Data Analysis:
By examining past sales data, retailers can identify patterns and trends that influence pricing decisions. For example, they can determine how seasonal demand, promotions, or economic conditions affect sales volumes and revenue.
Example: A retailer selling winter apparel can analyze sales data from previous years to set optimal prices for jackets and sweaters during peak winter months.
Market Trend Insights:
Retailers can leverage external data sources (e.g., industry reports, and economic indicators) to understand broader market trends. This helps them anticipate changes in consumer behavior or supply chain disruptions that may impact pricing.
Outcome: Retailers avoid underpricing (which erodes margins) or overpricing (which deters customers), ensuring they capture maximum revenue.
Dynamic Pricing
Real-Time Market Monitoring:
Dynamic pricing involves adjusting prices in real time based on factors like demand fluctuations, competitor pricing, and inventory levels. Retailers can use algorithms and machine learning to automate this process with pricing analytics.
Example: An e-commerce platform can increase the price of umbrellas during a sudden rainstorm or lower the price of overstocked items to clear inventory.
Demand Sensitivity:
By analyzing how price changes affect demand, retailers can identify the “sweet spot” where price and demand intersect to maximize revenue.
Outcome: Retailers stay competitive and responsive to market conditions, ensuring they don’t lose sales to competitors or miss out on higher margins.
Aligning Prices with Customer Value
Perceived Value Analysis:
Pricing analytics helps retailers understand how customers perceive the value of their products. This involves analyzing customer feedback, reviews, and purchasing behavior.
Example: A luxury brand may find that customers are willing to pay a premium for high-quality materials and exclusive designs, allowing them to justify higher prices.
Value-Based Pricing:
Instead of relying solely on cost-plus pricing, retailers can adopt value-based pricing strategies that reflect the benefits and experiences customers associate with the product.
Outcome: Prices resonate with customer expectations, leading to higher satisfaction, loyalty, and willingness to pay.
Identifying Pricing Opportunities
Product Category Analysis:
Retailers can use pricing analytics data to identify underperforming or overperforming product categories. This helps them focus on areas where price adjustments can drive higher profitability.
Example: A grocery store might discover that organic products have higher margins and lower price sensitivity, allowing them to increase prices without losing customers.
Price Elasticity Insights:
By understanding how sensitive customers are to price changes (price elasticity), retailers can identify products where small price increases won’t significantly impact sales volume.
Outcome: Retailers capture additional margins without risking a decline in sales, boosting overall profitability.
Competitive Analysis with Pricing Analytics
Competitor Price Tracking:
Retailers can use pricing analytics tools to monitor competitor pricing in real time. This helps them stay informed about market trends and adjust their strategies accordingly.
Example: An electronics retailer can track competitors’ prices for the latest smartphone model and offer a slightly lower price or additional perks to attract customers.
Benchmarking and Positioning:
By comparing their pricing strategies with competitors, retailers can identify gaps and opportunities. For instance, they may discover that they can position themselves as a premium brand or a budget-friendly alternative.
Outcome: Retailers gain a competitive edge by offering better value, attracting price-sensitive customers, or differentiating themselves in the market.
Key Pricing Analytics Techniques and Models
1. Price Elasticity Modelling
Measures how sensitive customer demand is to price changes. This fundamental pricing analytics technique helps retailers understand which products can sustain price increases and which require competitive pricing.
- Application: A retailer discovers their premium headphones have low elasticity (customers aren’t price-sensitive), allowing for higher margins, while their basic earbuds have high elasticity, requiring competitive pricing.
2. Competitive Price Benchmarking
Continuously monitoring and analysing competitor pricing across categories and geographies.
- Application: Using retail pricing analytics tools to track 5 key competitors’ prices on 500 SKUs daily, enabling automatic repricing to maintain competitive positioning.
3. Conjoint Analysis
Understanding how customers value different product features and what they’re willing to pay for them.
- Application: A smartphone manufacturer determines that customers value camera quality over battery life, justifying a higher price point for improved camera features.
4. Dynamic Pricing Algorithms
AI-powered systems that adjust prices in real-time based on demand, inventory, competitor actions, and market conditions.
- Application: An online retailer increases the prices of umbrellas by 15% during unexpected heavy rainfall, capturing additional revenue.
Stock-Aware Pricing Analytics: The Missing Link in Most Strategies
Most pricing analytics focuses exclusively on competitor prices and market demand. But there’s a critical variable that many retailers overlook: inventory levels. Stock-aware pricing integrates real-time inventory data into pricing decisions, creating a more dynamic and profitable approach.
Why Stock Levels Must Influence Pricing
| Inventory Scenario | Traditional Pricing Approach | Stock-Aware Pricing Approach |
|---|---|---|
| Overstock / Slow-Moving | Maintain price to protect margin | Reduce price to accelerate velocity and clear holding costs |
| Low Stock / High Demand | Keep price competitive | Increase price to maximize margin on remaining units |
| Seasonal End-of-Life | Standard markdown schedule | Aggressive discounting based on weeks of supply remaining |
| New Product Launch | Competitive positioning | Premium pricing if stock is limited; competitive if abundant |
| Restock Imminent | Hold price | Consider holding or slight discount; avoid deep cuts that deplete inventory before new stock arrives |
The Stock-Aware Pricing Framework
Step 1: Calculate Weeks of Supply (WOS)
Weeks of Supply = Current Inventory / Average Weekly Sales Velocity
Step 2: Set Inventory-Driven Price Zones
| WOS Range | Inventory Status | Pricing Strategy |
|---|---|---|
| 0-2 weeks | Critically Low | Premium pricing (+5-15%) to maximize margin; conserve stock |
| 2-4 weeks | Healthy | Target competitive pricing; maintain margin |
| 4-8 weeks | Elevated | Slight discounting (-5-10%) to accelerate velocity |
| 8+ weeks | Overstock | Aggressive discounting to clear; minimize holding costs |
Step 3: Combine with Competitive Intelligence
The most sophisticated pricing analytics approach layers competitor pricing on top of inventory signals:
Final Price = Base Price + Inventory Adjustment + Competitive Adjustment
Where:
- Inventory Adjustment: +5% for low stock, 0% for healthy, -5-15% for overstock
- Competitive Adjustment: Match or beat key competitors within margin thresholds
Real-World Example: Electronics Retailer
| Product | Current Stock | Weekly Velocity | WOS | Competitor Price | Stock-Aware Decision |
|---|---|---|---|---|---|
| Laptop A | 50 units | 25 units | 2 weeks | $999 | Hold at $999 (healthy stock, competitive) |
| Laptop B | 200 units | 20 units | 10 weeks | $1,199 | Discount to $1,099 (clear overstock) |
| Laptop C | 10 units | 30 units | <1 week | $899 | Increase to $949 (maximize margin on limited stock) |
Outcome: The retailer protects margin on scarce items, accelerates clearance on overstock, and maintains competitiveness where inventory is healthy.
Key Metrics for Pricing Analytics
Image Source: Business Wire
In order to conduct a thorough analysis and enhance the efficiency of retail pricing, it is essential to take into account specific crucial metrics.
These metrics offer valuable perspectives on the efficacy of pricing strategies and aid in pinpointing areas that may benefit from improvement.
Here are a few key metrics for retail pricing analysis:
Gross Margin
Definition and Importance:
Gross margin is the difference between revenue and the cost of goods sold (COGS), expressed as a percentage of revenue. It reflects how efficiently a retailer converts sales into profit.
Example: If a product sells for 100 and the COGS is 60, the gross margin is 40%.
Product Profitability Analysis:
By calculating gross margins for individual products or categories, retailers can identify high-margin items that drive profitability and low-margin items that may need reevaluation.
Actionable Insight: A retailer might discover that accessories (e.g., phone cases) have higher margins than the main products (e.g., smartphones) and focus on upselling them.
Pricing Adjustments:
If a product’s gross margin is too low, retailers can consider increasing the price, reducing costs, or discontinuing the product. Conversely, high-margin products can be promoted more aggressively.
Outcome: Retailers maximize profitability by focusing on products that contribute the most to their bottom line.
Price Elasticity
Understanding Price Sensitivity:
Price elasticity measures how changes in price affect customer demand. Products with high elasticity see significant demand changes with price fluctuations, while low-elasticity products are less sensitive.
Example: Luxury goods often have low elasticity (customers are less price-sensitive), while everyday items like groceries have high elasticity (customers are more price-sensitive).
Optimizing Revenue:
By understanding elasticity, retailers can set prices that balance volume and margin. For highly elastic products, small price reductions can lead to significant sales increases, while inelastic products can sustain higher prices.
Actionable Insight: A retailer might lower the price of a popular snack by 10%, leading to a 20% increase in sales and overall higher revenue.
Dynamic Pricing Strategies:
Elasticity insights with pricing analytics enable retailers to implement dynamic pricing, adjusting prices based on demand fluctuations, competitor actions, or inventory levels.
Outcome: Retailers achieve optimal pricing that maximizes both sales volume and profitability.
Customer Lifetime Value (CLV)
Definition and Calculation:
CLV represents the total revenue a retailer can expect from a customer over the entire duration of their relationship. It factors in repeat purchases, average order value, and retention rates.
Impact of Pricing Decisions:
Pricing strategies directly influence CLV. For instance, offering discounts to first-time customers can increase acquisition rates, but retailers must ensure these customers return at full price to maintain profitability.
Actionable Insight: A subscription-based business might offer a discounted trial period to attract customers, knowing that the long-term CLV will offset the initial discount.
Customer Retention:
By analyzing CLV, retailers can identify high-value customers and tailor pricing strategies (e.g., loyalty programs, and personalized discounts) to retain them.
Outcome: Retailers build long-term customer relationships, driving sustained revenue growth.
Market Share
Definition and Importance:
Market share represents the portion of total sales in a market that a retailer captures. It’s a key indicator of competitiveness and customer preference.
Pricing and Value Perception:
Market share is closely tied to pricing strategies. If customers perceive a retailer’s products as offering better value (quality, features, or price), they are more likely to choose that retailer over competitors.
Actionable Insight: A retailer might lower prices on key products to attract more customers and increase market share, even if it temporarily reduces margins.
Competitive Benchmarking:
By monitoring market share, retailers can assess the effectiveness of their pricing strategies relative to competitors. A growing market share indicates that their pricing is resonating with customers.
Outcome: Retailers gain a competitive edge by aligning their pricing with customer expectations and market dynamics.
The Price vs. Availability Interplay: What Happens When They Misalign
Price and availability don’t operate in isolation. Their interaction creates complex effects on conversion rates, customer satisfaction, and long-term loyalty.
The Four Quadrants of Price-Availability Alignment
                    AVAILABILITY
                High              Low
        ┌─────────────────────────────────┐
     Low │        QUADRANT 1       QUADRANT 2      │
         │   "Perfect Market"      "Danger Zone"   │
PRICE    │   High Conversion       High Conversion │
         │   Strong Margin         Customer Anger  │
         │   Competitive Edge      Brand Damage    │
        ├─────────────────────────────────┤
     High│        QUADRANT 3       QUADRANT 4      │
         │   "Margin Erosion"      "Premium Niche" │
         │   Low Conversion        Very Low Conv   │
         │   Profit Squeeze        High Margin     │
         │   Brand Devaluation     Loyalty Risk    │
        └─────────────────────────────────┘
Quadrant Analysis
Quadrant 1: Low Price + High Availability (The Sweet Spot)
- What happens: Maximum conversion, strong customer satisfaction
- Risk: Margin pressure if sustained long-term
- Strategy: Use for traffic drivers and competitive key items; monitor profitability
Quadrant 2: Low Price + Low Availability (The Danger Zone)
- What happens: Customers find great price but can’t buy; frustration, negative reviews, lost trust
- Real-world example: “Out of Stock” on a competitively priced item drives customers to competitors—who then capture the sale at full price
- Impact: 73% of customers who encounter an out-of-stock will buy elsewhere; many never return
- Strategy: Never promote low prices on items with low stock; raise price to slow velocity until restock
Quadrant 3: High Price + High Availability (Margin Erosion)
- What happens: Competitors with lower prices capture sales; your inventory sits, incurring holding costs
- Real-world example: Full-price winter coats in January while competitors are 40% off
- Impact: Carrying costs accumulate; eventual deeper discounts needed to clear
- Strategy: Match competitive pricing or signal value justification; consider markdowns
Quadrant 4: High Price + Low Availability (Premium Niche)
- What happens: Limited sales but high margin per unit; exclusivity perception
- Real-world example: Luxury brands with deliberately limited stock
- Impact: Sustainable for premium positioning; risky if customers perceive as “always out of stock”
- Strategy: Communicate scarcity as feature; manage expectations on restock timing
The Conversion Impact Matrix
| Scenario | Expected Conversion Rate | Customer Sentiment |
|---|---|---|
| Price Competitive + In Stock | HIGH (baseline +15-25%) | Positive, confident purchase |
| Price Competitive + Out of Stock | VERY LOW (80% drop) | Frustrated, likely to defect |
| Price High + In Stock | LOW (baseline -10-20%) | Shopping around |
| Price High + Out of Stock | NEAR ZERO | Confused, brand damage |
Key Insight: Being out of stock on a competitively priced item is the worst possible scenario. It combines the margin pressure of low price with the conversion loss of no inventory—and adds customer frustration on top.
Actionable Guidelines
- Align pricing with stock levels daily—not weekly or monthly
- Set “stock-out price floors”—when inventory drops below threshold, raise price to slow velocity and preserve margin on remaining units
- Never feature low prices in marketing for items with constrained inventory
- Monitor competitor price+stock combos—if a competitor is out of stock, you can maintain higher prices until they restock
Elasticity Bands Framework: Price-Sensitive vs. Availability-Sensitive SKUs
Not all products respond to pricing changes the same way. Some are highly price-sensitive (elastic), while others are more sensitive to availability than price. Understanding where each SKU falls on this spectrum transforms pricing strategy.
The Price-Availability Sensitivity Matrix
                    PRIMARY SENSITIVITY
                Price             Availability
        ┌─────────────────────────────────┐
    High│        BAND A            BAND B      │
         │   "Price Warriors"     "Impulse/Needs"│
SENSITIVITY│   Elastic Demand       Stock-Driven │
         │   React to cents        Buy if available│
        ├─────────────────────────────────┤
     Low │        BAND C            BAND D      │
         │   "Loyal/Indifferent"  "Premium/Specialty"│
         │   Stable Demand         Wait for Stock│
         │   Margin Opportunities  Brand Loyal  │
        └─────────────────────────────────┘
Band A: Price Warriors (High Price Sensitivity, Low Availability Sensitivity)
Characteristics:
- Commodity products, undifferentiated items
- Customers compare prices across multiple sellers
- Will wait for restock if price is right
- Examples: Basic electronics, common household items, staple groceries
Pricing Strategy:
- Must be competitive—even small premiums lose sales
- Monitor competitors continuously (daily or real-time)
- Price matching is essential
- Inventory matters less—customers will wait
Margin Impact: Low margins, high volume
Band B: Impulse/Needs (High Availability Sensitivity, High Price Sensitivity)
Characteristics:
- Urgent needs or impulse purchases
- Customers buy if available, regardless of small price differences
- Examples: Umbrellas during rain, last-minute gifts, emergency supplies
Pricing Strategy:
- Availability is everything—stock-outs are catastrophic
- Can command premium pricing when in stock
- Dynamic pricing based on urgency signals (weather, events, time)
- Monitor stock levels obsessively
Margin Impact: High margins when in stock; zero when out
Band C: Loyal/Indifferent (Low Price Sensitivity, Low Availability Sensitivity)
Characteristics:
- Brand-loyal customers
- Differentiated products with unique value
- Customers will wait or pay premium
- Examples: Specialty food items, niche hobbies, loyal brand followers
Pricing Strategy:
- Margin optimization opportunity—test price increases
- Less competitive monitoring needed
- Focus on brand experience and product quality
- Inventory less urgent
Margin Impact: High margins, stable volume
Band D: Premium/Specialty (Low Price Sensitivity, High Availability Sensitivity)
Characteristics:
- Luxury goods, limited editions, collectibles
- Customers want the item now; will pay premium
- Scarcity drives demand
- Examples: Limited release sneakers, luxury handbags, event tickets
Pricing Strategy:
- Premium pricing always—scarcity is feature, not bug
- Communicate “while supplies last”
- Create waitlists, not discounts
- Never discount—protects brand equity
Margin Impact: Very high margins, limited volume
How to Classify Your SKUs
Use this scoring system to place products in the right band:
Price Sensitivity Score (1-5):
- 5 = Customers buy elsewhere if price is $1 higher
- 3 = Moderate comparison shopping
- 1 = Customers buy regardless of small price differences
Availability Sensitivity Score (1-5):
- 5 = Customers need it now; won’t wait
- 3 = Will wait a few days
- 1 = Will wait weeks or indefinitely
Classification Rule:
- Band A: Price Sensitivity ≥4, Availability Sensitivity ≤2
- Band B: Both scores ≥4
- Band C: Both scores ≤2
- Band D: Price Sensitivity ≤2, Availability Sensitivity ≥4
The Role of Technology in Pricing Analytics
ECommerce analytics tools like 42Signals provide retailers with the capabilities to collect, analyze, and interpret vast amounts of pricing data.

These tools offer features such as:
- Historical pricing data analysis: Retailers can gain insights from their past pricing strategies and their impact on sales and profitability.
- Competitive pricing analysis: Retailers can track competitor pricing strategies, allowing them to make informed pricing decisions and stay competitive in the market.
- Real-time market monitoring: E-commerce analytics tools provide real-time data on market conditions, allowing retailers to adjust their pricing strategies promptly.
- Predictive analytics: By utilizing advanced algorithms and machine learning techniques, retailers can forecast future pricing trends and make data-driven pricing decisions.
Promo Lift vs. Margin Trade-Off: When Discounting Helps and When It Hurts
Promotions are a double-edged sword. They drive volume but erode margin. Understanding the trade-off is essential for profitable promotion planning.
The Promo Profitability Equation
Net Promo Profit = (Promo Volume × Promo Margin) - (Baseline Volume × Baseline Margin)
Where:
- Promo Volume = Units sold during promotion
- Promo Margin = Revenue per unit – COGS (after discount)
- Baseline Volume = Expected units without promotion
- Baseline Margin = Normal margin per unit
When Promotions Work: The Incrementality Test
A promotion is profitable only if it drives incremental volume—sales that wouldn’t have happened at full price.
Scenario A: Profitable Promotion
| Metric | Baseline (No Promo) | Promo (-15%) | Change |
|---|---|---|---|
| Price | $100 | $85 | -15% |
| Units Sold | 1,000 | 1,800 | +80% |
| Revenue | $100,000 | $153,000 | +53% |
| COGS ($60/unit) | $60,000 | $108,000 | +80% |
| Gross Profit | $40,000 | $45,000 | +12.5% |
Result: Volume increase (80%) outpaced margin erosion, generating incremental profit.
Scenario B: Unprofitable Promotion
| Metric | Baseline (No Promo) | Promo (-15%) | Change |
|---|---|---|---|
| Price | $100 | $85 | -15% |
| Units Sold | 1,000 | 1,100 | +10% |
| Revenue | $100,000 | $93,500 | -6.5% |
| COGS ($60/unit) | $60,000 | $66,000 | +10% |
| Gross Profit | $40,000 | $27,500 | -31% |
Result: Small volume increase (10%) couldn’t offset margin loss; promotion destroyed profit.
The Promo Efficiency Framework
When to Promote:
| Scenario | Promo Recommended? | Rationale |
|---|---|---|
| High elasticity, healthy margin | YES | Volume response will outweigh discount |
| Overstock / Slow-moving | YES | Better to recover some margin than incur holding costs |
| New customer acquisition | CONDITIONAL | If CLV justifies initial margin loss |
| Competitive key item | CONDITIONAL | Defend market share strategically |
When NOT to Promote:
| Scenario | Promo Recommended? | Rationale |
|---|---|---|
| Low elasticity, thin margin | NO | Volume won’t increase enough |
| Low stock / Scarce item | NO | Maximize margin on remaining units |
| Premium/luxury positioning | NO | Brand damage outweighs short-term gain |
| Regular, predictable demand | NO | You’re just discounting existing sales |
Measuring Promo Lift Accurately
Common Mistake: Comparing promo sales to average weekly sales
Correct Approach: Compare to baseline—expected sales without promotion, accounting for:
- Seasonality
- Underlying growth trends
- Marketing support during promo period
- Competitive activity
Lift Calculation:
True Incremental Lift = (Promo Period Sales - Baseline Sales) / Baseline Sales
The Diminishing Returns Curve
Most categories follow a pattern of diminishing returns on discount depth:
| Discount Depth | Expected Lift | Profit Impact |
|---|---|---|
| 5% | +5-10% | Slightly positive |
| 10% | +15-25% | Positive |
| 15% | +25-40% | Peak profitability |
| 20% | +35-50% | Flat/declining |
| 25%+ | +40-60% | Negative (margin erosion) |
Key Insight: There’s usually a “sweet spot” where discount depth maximizes profit lift. Deeper discounts often destroy more margin than they generate in incremental volume.
Implementing Retail Pricing Analytics Strategies
Achieving success in implementing retail pricing strategies necessitates meticulous planning and precise execution.
Consider the following essential steps for pricing analytics:
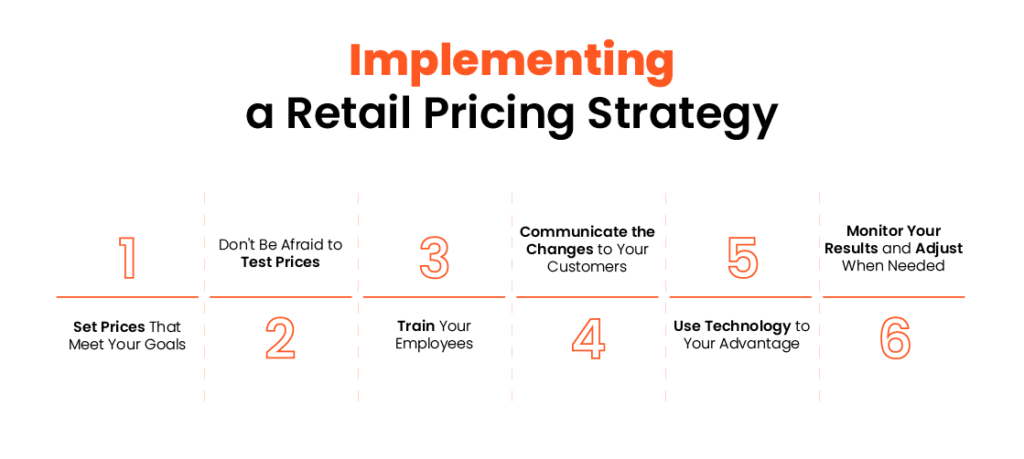
Image Source: Brandly
- Define Pricing Objectives: Clearly articulate the goals of your pricing strategy, whether the focus is on boosting sales, optimizing profits, or gaining a larger market share.
- Gather Data and Analyze: Collect relevant data on competitor pricing, market trends, and customer preferences. Analyze this data to identify patterns and insights that inform your pricing decisions.
- Develop Pricing Models: Develop pricing models that consider factors such as cost, demand, competition, and customer value perception. Test different pricing scenarios to identify the most profitable approach.
- Monitor and Adjust: Continuously monitor the effectiveness of your pricing strategies and make adjustments as needed. Regularly review pricing data and market trends to stay ahead of the competition.
What to Instrument: Required Data Inputs for Pricing Analytics
Effective pricing analytics requires quality data—consistently collected, properly structured, and updated at appropriate frequencies. Here’s what you need to instrument.
Data Inputs Table for Pricing Analytics
| Data Category | Specific Input | Collection Cadence | Source | Why It Matters |
|---|---|---|---|---|
| Internal Pricing | Current retail price by SKU | Real-time | POS / E-commerce platform | Baseline for all analysis |
| Historical price changes | Daily archive | Pricing system | Understand elasticity, promo effectiveness | |
| MAP thresholds | As updated | Policy document | Compliance monitoring | |
| Competitor Pricing | Competitor prices by SKU | Daily (real-time for key items) | Web scraping / 3rd party APIs | Competitive positioning, repricing triggers |
| Competitor promo activity | Daily | Promo calendar tracking | Context for your pricing decisions | |
| Competitor stock status | Daily | Site monitoring | Out-of-stock opportunities | |
| Inventory | Current stock levels by SKU | Real-time | Inventory management system | Stock-aware pricing |
| Weeks of supply | Daily calculation | Inventory + sales data | Inventory-driven price zones | |
| Incoming shipments | Weekly | Supply chain system | Future availability planning | |
| Sales Performance | Unit sales by SKU | Daily | POS / E-commerce | Velocity tracking, baseline calculation |
| Sell-through rate | Weekly | Sales + inventory | Inventory health | |
| Conversion rate by price point | Daily | Analytics platform | Price sensitivity signals | |
| Customer Data | Price elasticity by segment | Monthly analysis | Historical sales + pricing | Targeting, personalization |
| CLV by acquisition channel | Monthly | CRM + sales data | Promo ROI by customer type | |
| Search rank by keyword | Weekly | Marketplace analytics | Visibility impact of price | |
| Market Context | Seasonality factors | Annual with monthly updates | Historical sales | Baseline adjustment |
| Economic indicators | Monthly | External data | Demand forecasting | |
| Category trends | Quarterly | Industry reports | Strategic positioning | |
| Promotion Calendar | Active promotions by SKU | Real-time | Marketing calendar | Alert suppression, attribution |
| Promo performance history | Per promo | Post-promo analysis | Future planning | |
| Competitor promo calendar | Weekly | Competitive monitoring | Strategic timing |
Cadence Guidelines by Decision Type
| Decision Type | Required Data Freshness | Update Frequency |
|---|---|---|
| Dynamic repricing | Real-time competitor + stock | Continuous monitoring |
| Daily price adjustments | Daily competitor + inventory | 1x per day minimum |
| Promo planning | Weekly competitive + historical | Weekly review |
| Strategic pricing | Monthly market + segment data | Monthly analysis |
| Annual pricing strategy | Annual trends + benchmarks | Quarterly check-ins |
Instrumentation Checklist
Before implementing pricing analytics, ensure you have:
- SKU-level sales data with daily granularity
- Competitor price feeds for top 5-10 competitors on key SKUs
- Real-time inventory levels integrated with pricing systems
- Historical price changes logged with timestamps
- Promotion calendar with discount depths and dates
- Baseline sales models accounting for seasonality and trends
- Elasticity calculations by SKU or category
- Margin data (COGS) for profitability analysis
Pricing Analytics Use Cases Across Retail Categories
Apparel & Fashion Retail
- Challenge: Seasonal inventory with short lifecycles
- Solution: Apparel pricing analytics solutions that optimize markdown timing and depth
- Result: 22% improvement in full-price sell-through and reduced clearance inventory
Electronics & Technology
- Challenge: Rapid product obsolescence and competitive pressure
- Solution: Predictive pricing analytics for new product introductions and end-of-life pricing
- Result: 18% higher margins during product lifecycle
Grocery & CPG
- Challenge: High volume, low margins, and intense competition
- Solution: Real-time pricing analytics for promotional optimization and basket analysis
- Result: 12% increase in promotional ROI and higher average transaction value
E-commerce & Marketplace
- Challenge: Millions of SKUs requiring constant price optimization
- Solution: Ecommerce pricing analytics platforms with automated repricing rules
- Result: 35% improvement in price competitiveness while maintaining target margins
The Pricing Analytics Technology Stack
Modern pricing analytics software typically includes:
Data Collection Layer
- Competitor Price Tracking: Automated scraping of competitor websites and marketplaces
- Internal Data Integration: Connecting POS, ERP, and e-commerce platforms
- Market Data Feeds: Incorporating economic indicators and industry trends
Analytics & Modeling Layer
- Machine Learning Algorithms: For demand forecasting and price optimization
- Statistical Models: For price elasticity and promotion effectiveness
- Visualization Tools: Dashboards for monitoring KPIs and performance
Execution & Optimization Layer
- Price Recommendation Engine: Suggests optimal prices based on business rules
- Integration APIs: Connect pricing decisions to e-commerce platforms and POS systems
- Testing Frameworks: A/B testing capabilities for price validation
Pricing Analytics Decision Framework: When to Reprice vs. When to Hold
Knowing when to adjust prices—and when to stay put—is the essence of effective pricing analytics. This framework helps you make consistent, data-driven decisions.
Decision Triggers Matrix
| Trigger Type | Signal | Action | Hold Condition |
|---|---|---|---|
| Competitive Gap | Competitor price >5% below yours on comparable SKU | Consider matching within margin thresholds | Your product has differentiation; margin too thin; competitor is outlier |
| Stock Threshold | WOS >8 weeks (overstock) | Reduce price to accelerate velocity | Product has long shelf life; upcoming promotion planned |
| Stock Threshold | WOS <2 weeks (low stock) | Increase price to maximize margin | Premium positioning; restock imminent |
| Demand Signal | Conversion rate drops >15% without explanation | Investigate competitor activity; consider price test | Temporary fluctuation; traffic issue |
| Demand Signal | Search rank drops >20% | Check competitor pricing; consider adjustment | Algorithm change; seasonal shift |
| Promo Calendar | Approved promotion period | Apply scheduled discount | Outside promo window |
| Seasonal Event | End of season approaching | Begin markdown schedule | Premium brand with no seasonal discounting |
| New Entry | New competitor enters market | Monitor; consider defensive pricing | Your market position strong; new competitor not yet proven |
The Reprice Decision Tree in Pricing Analytics
                    ┌─────────────────────┐
                    │  Price Alert Trigger │
                    └──────────┬──────────┘
                               │
                    ┌──────────▼──────────┐
                    │  Verify Signal       │
                    │  (real violation?)   │
                    └──────────┬──────────┘
                               │
                    ┌──────────▼──────────┐
                    │  Check Stock Level   │
                    └──────────┬──────────┘
                               │
        ┌──────────────────────┼──────────────────────┐
        │                      │                      │
┌───────▼───────┐      ┌───────▼───────┐      ┌───────▼───────┐
│  Low Stock    │      │  Healthy Stock│      │  Overstock    │
│  (WOS <2)     │      │  (WOS 2-4)    │      │  (WOS >4)     │
└───────┬───────┘      └───────┬───────┘      └───────┬───────┘
        │                      │                      │
┌───────▼───────┐      ┌───────▼───────┐      ┌───────▼───────┐
│  Consider     │      │  Check Margin │      │  Aggressive   │
│  Price INCREASE│     │  Headroom     │      │  Reprice      │
│  to maximize  │      └───────┬───────┘      │  to clear     │
│  margin       │              │              └───────┬───────┘
└───────────────┘      ┌───────▼───────┐              │
                        │  Margin >20%? │              │
                        └───────┬───────┘              │
                                │                      │
                    ┌───────────┴───────────┐          │
                    │                       │          │
            ┌───────▼───────┐       ┌───────▼───────┐  │
            │     YES       │       │     NO        │  │
            │ Match Price   │       │ Hold or       │  │
            │               │       │ Partial Match │  │
            └───────────────┘       └───────────────┘  │
                    │                       │          │
                    └───────────┬───────────┘          │
                                │                      │
                    ┌───────────▼───────────┐          │
                    │   Execute Decision    │◄─────────┘
                    │   within 24 hours     │
                    └───────────────────────┘
When to Hold: The “No Action” Scenarios
Sometimes the best decision is to do nothing. Hold conditions in pricing analytics can include:
1. Competitor is the Outlier
- One competitor is dramatically lower than all others
- Likely a pricing error or loss leader
- Don’t chase; monitor for correction
2. Your Product is Differentiated
- Better quality, service, or features justify premium
- Brand positioning supports higher price
- Hold and communicate value
3. Margin Can’t Support Match
- Matching would erase or invert margin
- Hold and accept some volume loss
- Consider whether product is worth carrying
4. Stock Position Doesn’t Justify Change
- Healthy inventory with good velocity
- No pressure to move units
- Hold current price
5. Temporary Market Fluctuation
- Flash sale by competitor (24-48 hours)
- Holiday promotion you’re not participating in
- Wait it out
6. Strategic Brand Positioning
- Premium brand with price integrity
- Discounting would damage long-term equity
- Hold as brand statement
The Future of Pricing Analytics
As technology progresses, the future outlook for pricing analytics appears promising.
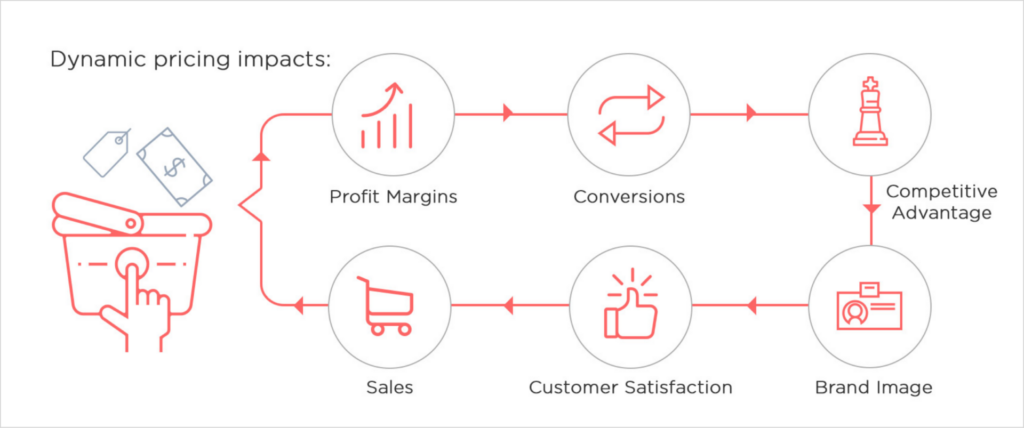
An example of dynamic pricing impact
Several trends are anticipated to shape the evolution of this field:
- Increased Incorporation of Artificial Intelligence (AI): AI-driven algorithms are poised to manage extensive sets of pricing data. It also helps with furnishing retailers with actionable insights and recommendations.
- Personalized Pricing: Retailers are expected to utilize customer data and AI algorithms to deliver tailored pricing based on individual customer preferences, purchasing history, and loyalty.
- Real-Time Pricing Adjustments: The evolution of advanced analytics tools empowers retailers to dynamically modify prices. Responding to factors such as inventory levels, customer demand fluctuations, and competitive pricing dynamics.
- Integration of Omnichannel Data: Retailers are expected to persist in integrating data from diverse channels. E-commerce platforms, physical stores, and mobile applications—enabling a comprehensive understanding of customer behavior and facilitating the optimization of pricing strategies across all channels.
Retail pricing analytics stands as a potent tool capable of significantly enhancing retailers’ profitability.
By harnessing appropriate technology and scrutinizing key metrics, retailers can formulate and execute effective pricing strategies.
Looking to boost your profits through retail pricing data? Look no further than 42Signals. Contact us at sales@42signals.com to book a FREE demo!
Frequently Asked Questions (FAQs)
What are the 4 pricing strategies?
- Cost-plus Pricing: This strategy involves adding a fixed percentage markup to the cost of producing or acquiring a product or service. It is a straightforward approach that ensures a minimum profit margin but may not take into account market conditions or customer demand.
- Value-based Pricing: In this strategy, businesses set prices based on the perceived value of their products or services to customers rather than on production costs. By understanding what customers are willing to pay, companies can maximize revenue and differentiate themselves from competitors.
- Competitive Pricing: Companies using this strategy match or beat the prices of their closest competitors. While it helps maintain a competitive edge in the market, it may limit profits if margins are already thin.
- Dynamic Pricing: Also known as price discrimination, dynamic pricing adjusts prices based on factors such as time, location, and consumer behavior. Examples include surge pricing used by ride-sharing apps like Uber or fluctuating airfare prices seen on travel websites.
What are the 3 C’s of pricing strategy?
- Cost: Understanding the total cost involved in creating or delivering your product or service is essential when determining prices. Consider both variable costs (those associated with each unit produced) and fixed costs (overhead expenses).
- Customers: Knowing your target market and their preferences, needs, and willingness to pay plays a significant role in developing an effective pricing strategy. Conduct market research to gather insights about your ideal customers and tailor your pricing accordingly.
- Competitors: Analyzing the competition enables you to position yourself effectively within the market and identify opportunities to differentiate your offerings. Keep track of industry trends, competitor pricing tactics, and market conditions to make well-informed pricing decisions.