
Why Share of Search Is the Most Powerful Leading Indicator Your Brand Isn’t Tracking
When your sales start dropping, most brands look inward. The real signal is often hiding in search. Share of Search — the percentage of category searches your brand captures versus competitors — is a proven leading indicator of market share movement, typically by 3–6 months. This guide covers how to measure it, how to identify the keyword gaps your competitors are exploiting, and how to build the tracking system that turns search visibility into a strategic KPI your finance team will actually care about.
Share of Search: The Complete Guide to Measurement, Competitive Gap Analysis, and Market Share Prediction
Share of Search is a powerful metric that represents the percentage of searches a brand captures in comparison to its competitors for specific keywords. This measurement via a share of search tool is crucial for understanding a brand’s visibility and prominence in the digital marketplace.
This is where Share of Search (SoS) emerges as a transformative, yet frequently underestimated, key performance indicator. By assessing how frequently a brand appears in search results relative to its competitors, marketers can gauge the effectiveness of their SEO strategies and overall market presence.
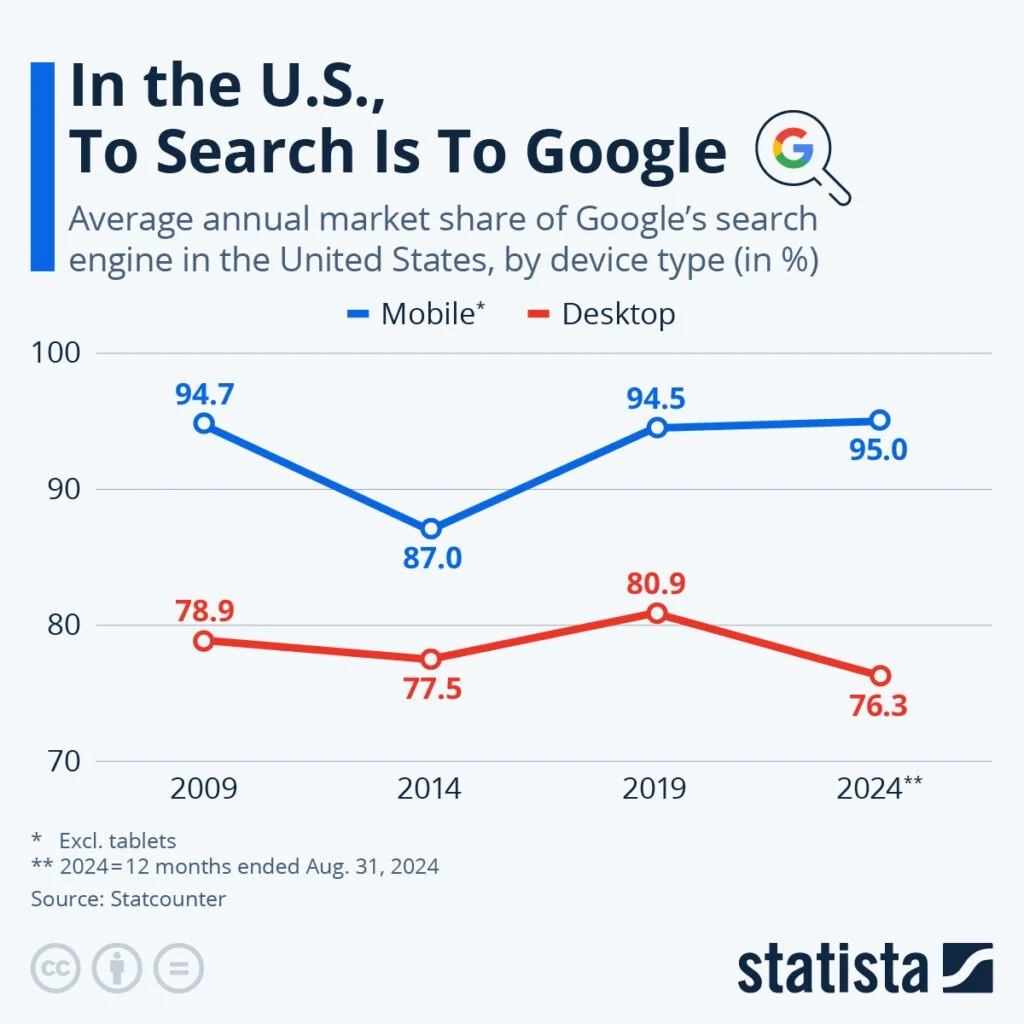
Image Source: Statista
Think of it as a real-time, always-on opinion poll of consumer demand and intent, offering a powerful proxy for future market share.
Measurement Methodology: How Share of Search Is Calculated
Understanding the precise methodology behind Share of Search is essential for accurate measurement and meaningful benchmarking. Here’s the technical framework used by leading brands and analytics platforms.
The Core Formula
Here’s how to calculate share of search for your brand –
Share of Search (%) = (Your Brand’s Search Volume for Target Keywords)
÷ (Total Search Volume for All Competing Brands in Category)
× 100
Step-by-Step Calculation Process
Step 1: Define Your Competitive Set
Identify the brands that compete with you for visibility in search results. This includes:
- Direct competitors (selling identical products)
- Category competitors (selling similar products)
- Emerging threats (new entrants gaining traction)
Example (Skincare Category):
- Your Brand: “GlowSkin”
- Competitors: “PureRadiance,” “DermaCare,” “NaturalGlow,” “YouthLab”
Step 2: Build Your Keyword Universe
Create a comprehensive list of keywords that define your category. This should include:
| Keyword Type | Examples | Purpose |
| Branded Terms | “GlowSkin moisturizer,” “PureRadiance serum” | Measure brand-specific demand |
| Category Terms | “face moisturizer,” “anti-aging cream” | Measure category presence |
| Product Terms | “vitamin C serum,” “SPF 50 sunscreen” | Measure product-specific visibility |
| Intent Terms | “best moisturizer for dry skin,” “how to apply serum” | Capture consideration-stage searches |
| Long-Tail Terms | “fragrance-free moisturizer for sensitive skin” | Measure niche dominance |
Step 3: Collect Search Volume Data
Gather monthly search volume for each keyword across your competitive set. Reliable sources include:
| Data Source | Coverage | Accuracy | Cost |
| Google Keyword Planner | Google only | High | Free (with ads account) |
| SEMrush | Multi-platform | High | Paid |
| Ahrefs | Multi-platform | High | Paid |
| 42Signals | Ecommerce platforms + search | High | Paid |
| Google Trends | Google only | Medium (indexed) | Free |
Step 4: Calculate Category Totals
For each keyword, sum the search volume across all competing brands:
Total Category Search Volume = Sum of (Brand A Volume + Brand B Volume + … + Brand N Volume)
Step 5: Calculate Your Share
Your Share of Search = (Your Brand Volume ÷ Total Category Volume) × 100
Data Sources That Matter
For ecommerce brands, Share of Search isn’t limited to Google. A comprehensive view includes:
| Platform | Why It Matters | What to Measure |
| Google Search | Largest search engine, broadest intent | Brand + category keyword rankings |
| Amazon Search | Product discovery, purchase intent | Organic rank, sponsored placements |
| Walmart/Search | Retail media growth | Product visibility, share of first page |
| YouTube | Second largest search engine | Video rankings, view share |
| Social Platforms | Discovery for younger demographics | Hashtag volume, profile searches |
| Ecommerce Marketplaces | Category-specific platforms | Search rank by marketplace |
Benchmarking Your Share of Search
Internal Benchmarking:
- Track your SoS month-over-month
- Measure SoS by product category
- Compare SoS across different platforms
Competitive Benchmarking:
- Compare your SoS to direct competitors
- Track leader’s SoS as target
- Monitor emerging competitors’ growth rate
Category Benchmarking:
- Average SoS for market leaders: 30-50%
- Strong challenger brands: 15-25%
- Niche players: 5-15%
- New entrants: <5%
Common Measurement Pitfalls
| Pitfall | Impact | Solution |
| Narrow keyword set | Misses category nuances | Include long-tail and intent terms |
| Ignoring platforms | Incomplete view | Measure across all relevant channels |
| Infrequent measurement | Miss trends | Track monthly at minimum |
| No competitive benchmarking | SoS in isolation is meaningless | Always compare to competitors |
| Seasonality blind spots | Misinterpret fluctuations | Compare year-over-year, not month-over-month |
What Role Do Keywords Play in Share of Search?
Keywords are far more than just SEO metadata or pay-per-click bid terms; they are the literal language of your customer’s intent. They are the questions, needs, desires, and problems typed into a search bar. In the context of Share of Search, they serve as the fundamental unit of measurement and the primary lever for influence.
1. Relevance
The core function of keywords is to create relevance. Every search query is a signal of intent—whether informational (“what is the best SPF”), navigational (“La Roche-Posay official website”), or commercial (“buy minimalist sunscreen 50g”). By meticulously researching and targeting the keywords your audience uses, you ensure your brand is present at the exact moment a purchase decision is being considered.
This alignment transforms your content and product pages from mere advertisements into valuable solutions, directly increasing your relevance and, consequently, your share of those critical search results.
2. Competitor Benchmarking with a Share of Search Tool
Keywords provide the X-ray vision needed to see through your competitors’ strategies. By analyzing the keyword landscape, you can answer pivotal questions:
- Which specific terms are they ranking for organically?
- What paid keywords are they bidding on aggressively?
- Which high-value keywords have they overlooked, presenting a potential opportunity for your brand?
- How does their keyword portfolio shift with new product launches or seasonal trends?
This benchmarking turns a abstract concept of “competition” into a tangible, analyzable dataset. You’re no longer guessing their strategy; you’re reverse-engineering it through their keyword choices.
3. Product Strategy
Effective use of keywords can drive your product strategy that resonates with search intent, thereby increasing your share of search.
A surge in searches for “reef-safe sunscreen” or “mineral sunscreen for sensitive skin” is not just a trend to capitalize on in ads; it’s a clear directive from the market about evolving consumer preferences. A brand that tracks these keyword trends can adapt its product formulation, highlight these features in its listings, and create educational content that addresses these specific concerns.
This proactive approach, driven by search data, ensures your offerings resonate deeply with search intent, capturing a larger share of demand and establishing your brand as a forward-thinking leader.
Keywords are, therefore, the essential bridge. They connect the uncharted territory of user intent to the owned land of your brand’s digital visibility. Without a sophisticated keyword strategy, attempts to increase Share of Search are akin to sailing without a compass.
Why Tracking Competitors’ Share of Search Gives You a Strategic Edge
In the digital arena, your competitors are only a click away from your customers. Ignoring their presence and performance is a strategic blind spot with significant consequences. A dedicated Share of Search tool transforms this competitive intelligence from a sporadic manual task into a systematic, actionable strategy.
1. Competitive Advantage
Understanding your competitors’ Share of Search is not about imitation; it’s about innovation and differentiation. By monitoring their keyword strengths and weaknesses, you can identify gaps in the market. If all major competitors are dominating broad, high-volume terms like “sunscreen,” but neglecting long-tail, high-intent keywords like “oil-free sunscreen for acne-prone skin,” you have identified a blue ocean. You can dominate this niche, capturing highly qualified traffic and converting it at a higher rate, thereby building a defensible competitive moat.
2. Consumer Insights
Competitors’ keyword rankings are a reflection of what the market is responding to. The terms they successfully rank for are validated by consumer clicks and engagement. By analyzing this, you gain indirect but incredibly valuable insights into consumer preferences without commissioning expensive market research. You can see which features are being searched for, which benefits are emphasized, and even how language and terminology evolve within your category. This is real-world, behavior-based data that is unparalleled in its honesty.
3. Performance Measurement
Vanity metrics like website traffic or social media likes can be misleading. Share of Search provides a relative and objective measure of your marketing performance. Are your recent SEO efforts actually helping you steal visibility from Competitor A? Is your new content campaign increasing your share for your core branded terms? By tracking your Share of Search over time and against specific competitors, you can directly correlate marketing activities with changes in market visibility, justifying investments and pivoting quickly from underperforming tactics.
4. Market Adaptation
Keeping an eye on competitors’ keyword strategies helps you adapt to market changes swiftly, ensuring your brand remains relevant and competitive.
A Share of Search tool provides real-time alerts. If a competitor suddenly gains rank for a cluster of important keywords, you can be notified immediately. This allows you to investigate—did they launch a new product? Run a major PR campaign? Change their page metadata?—and adapt your strategy in days, not months, ensuring your brand remains perpetually relevant and competitive.
In essence, tracking competitors through Share of Search is about moving from a reactive to a proactive stance. It’s about anticipating market shifts and seizing opportunities before they become obvious to everyone else.
Manual vs. Automated Share of Search Tracking: Which Approach Is Right for You?
For measuring share of search, leveraging advanced tools is essential. Theoretically, one could attempt to track Share of Search manually. This would involve:
- Creating a massive spreadsheet of hundreds of industry-relevant keywords.
- Manually searching for each keyword on each target platform (e.g., Amazon, Google, Flipkart) in different geographies to account for location-based results.
- Recording the position of your products and your competitors’ products for every single search.
- Repeating this process daily or weekly to track movements.
- Attempting to synthesize this overwhelming data into a coherent percentage or insight.
This process is not only mind-numbingly tedious and time-consuming but also fundamentally flawed. It is prone to human error, impossible to scale, and instantly outdated. The sheer volume of data and the speed at which search results change make manual tracking completely impractical for any brand serious about competing online.
To effectively monitor and optimize your Share of Search, leveraging advanced, automated tools is not a luxury; it is an absolute necessity. One such tool designed specifically for this purpose is 42Signals.
Why Share of Search Predicts Market Share: The Proven Connection
This is the most powerful insight about Share of Search—and the hook that drives interest from senior marketers and executives.
The Research Foundation
Multiple studies have established a strong correlation between Share of Search and actual market share:
| Study | Key Finding | Industry |
| Les Binet & Peter Field (2020) | SoS is a leading indicator of market share by 3-6 months | Multiple categories |
| Grainne McGann (2019) | 0.8-0.9 correlation between SoS and market share | FMCG |
| Econsultancy / Hitwise | SoS predicts market share with 80% accuracy | Retail |
| Nielsen | Brand searches correlate with sales | CPG |
Why the Correlation Exists
The Mental Availability Framework
Marketing effectiveness expert Professor Byron Sharp’s work on “mental availability” explains why search predicts sales:
- Search is the modern expression of top-of-mind awareness. When consumers think of a category, the brands that come to mind are the ones they search for.
- Search reflects consideration. Before purchase, consumers research. Their searches reveal which brands are in the consideration set.
- Search is unprompted. Unlike surveys, search behavior is natural, unfiltered, and honest. No one biases their search history.
- Search leads to traffic. Higher search visibility drives more website visits, which drives more conversions.
The Time Lag: Search as Leading Indicator
Share of Search typically leads market share by 3-6 months. This creates a powerful strategic opportunity:
Month 1-3: SoS increases (marketing working)
Month 4-6: Market share follows (sales catch up)
Why the lag?
- Consideration cycles take time
- Purchase decisions aren’t instantaneous
- Distribution and availability may lag demand
- Word-of-mouth amplifies initial visibility
Real-World Validation
Case Example: Challenger Brand Growth
| Quarter | Share of Search | Market Share (following quarter) |
| Q1 | 8% | 6% |
| Q2 | 12% | 9% |
| Q3 | 15% | 13% |
| Q4 | 18% | 16% |
Correlation: 0.92 — SoS increases consistently predicted market share gains 3 months later.
The Predictive Power by Category
| Category | Correlation Strength | Lag Time |
| FMCG / CPG | Very strong (0.8-0.9) | 2-4 months |
| Consumer Electronics | Strong (0.7-0.8) | 3-6 months |
| Fashion/Apparel | Strong (0.7-0.8) | 2-5 months |
| Automotive | Moderate (0.6-0.7) | 6-12 months |
| B2B Services | Moderate (0.5-0.6) | 6-18 months |
Actionable Implications
For Marketing Leaders:
- Use SoS as a early warning system for market share changes
- Invest more in channels that drive SoS
- Set SoS targets as leading indicators
For Finance/Executives:
- Accept SoS as a valid predictor of future revenue
- Fund marketing based on SoS impact
- Monitor SoS in board reporting
For Brand Managers:
- Track SoS weekly/monthly
- Correlate marketing activities with SoS changes
- Build business cases around SoS improvements
The Key Takeaway
Share of Search isn’t just a vanity metric—it’s a financial leading indicator. When your SoS rises, your future market share is likely to follow. When it falls, you’re losing ground before sales figures reflect the damage.
This transforms SoS from a “nice to know” into a “must track” strategic KPI.
Want to replicate this kind of analysis for your own category? 42Signals tracks Share of Search across Amazon, Flipkart, Google, and Walmart in a single dashboard — with automated alerts when competitor visibility changes. Book a personalised demo and we’ll run a live gap analysis of your competitive set.
Step-by-Step Guide: How to Track Share of Search Over Time
Whether you’re starting manually or investing in tools, here’s how to implement consistent SoS tracking.
Option 1: Manual Tracking (For Small Brands / Getting Started)
Pros: Low cost, builds understanding
Cons: Time-consuming, limited scale, prone to error
Step 1: Identify Your Keywords (Monthly)
- List 20-50 core category and brand keywords
- Include branded terms for top 5 competitors
- Document in a spreadsheet
Step 2: Collect Volume Data (Monthly)
- Use Google Keyword Planner (free)
- Record search volume for each keyword
- Note: Google provides ranges, not exact numbers
Step 3: Calculate Totals (Monthly)
- Sum all brand volumes for each keyword
- Calculate your percentage
Step 4: Track Trends (Quarterly)
- Create a simple line chart
- Look for directional changes
- Correlate with marketing activities
Manual Tracking Template:
| Keyword | Your Volume | Competitor A | Competitor B | Competitor C | Total | Your Share |
| “sunscreen” | 2,400 | 3,600 | 1,800 | 1,200 | 9,000 | 26.7% |
| “SPF 50” | 1,800 | 2,700 | 900 | 600 | 6,000 | 30.0% |
| TOTAL | 4,200 | 6,300 | 2,700 | 1,800 | 15,000 | 28.0% |
Option 2: Tool-Assisted Tracking (Recommended for Growth Brands)
Pros: Scalable, accurate, real-time, multi-platform
Cons: Monthly investment required
Step 1: Select Your Platform
- Choose a tool like 42Signals that combines:
- Search volume data
- Competitor tracking
- Multi-platform coverage
- Automated reporting
Step 2: Configure Your Competitive Set
- Input your brand and top 5-10 competitors
- Define product categories
- Set geographic targets
Step 3: Define Keyword Universe
- Use tool’s keyword research features
- Import your existing keyword lists
- Let AI suggest relevant terms
Step 4: Set Up Dashboards
- Create views by:
- Brand vs. competitors
- Category vs. product terms
- Platform (Google, Amazon, etc.)
- Time trends
Step 5: Establish Alert Thresholds
- Alert when your SoS drops >10%
- Alert when competitor SoS spikes
- Alert on new competitor entries
Step 6: Regular Review Cadence
| Frequency | Activities | Attendees |
| Weekly (30 min) | Review alerts, urgent issues | SEO, PPC managers |
| Monthly (1 hour) | Trend analysis, competitive shifts | Marketing team |
| Quarterly (2 hours) | Deep dive, strategy reset | Marketing + leadership |
Tracking Across Platforms
For ecommerce brands, multi-platform tracking is essential:
| Platform | What to Track | Tool Feature |
| Organic rank, search volume | Keyword tracking | |
| Amazon | Search rank, share of first page | Marketplace analytics |
| Walmart | Product visibility | Retail media tracking |
| YouTube | Video rankings | Video SEO tools |
| Social | Hashtag volume | Social listening |
Frequency Recommendations
| Brand Size | Recommended Cadence | Minimum Cadence |
| Enterprise | Weekly | Monthly |
| Mid-Market | Monthly | Quarterly |
| Small Brand | Quarterly | Bi-annually |
| New Launch | Weekly | Monthly |
Competitor Gap Analysis Framework: Identifying Opportunities
Share of Search analysis is powerful, but its real value lies in identifying gaps—places where competitors are winning and you’re not, and vice versa.
The Competitor Gap Analysis Matrix
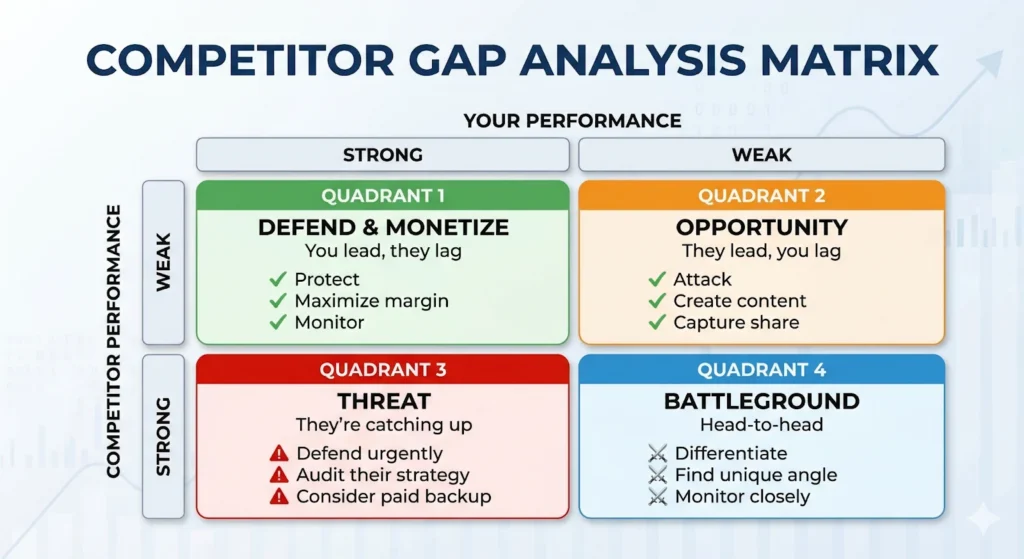
Quadrant Analysis in Practice
Quadrant 1: Defend & Monetize (You Strong, Competitor Weak)
- Strategy: Defend aggressively, maximize ROI
- Actions:
- Maintain content freshness
- Consider reducing spend (efficient)
- Monitor for competitor moves
- Use as profit center
Quadrant 2: Opportunity (You Weak, Competitor Weak)
- Strategy: Quick win potential
- Actions:
- Create targeted content
- Optimize for these terms
- Capture unserved demand
- Low-hanging fruit
Quadrant 3: Threat (You Weak, Competitor Strong)
- Strategy: Defensive priority
- Actions:
- Audit competitor content
- Identify why they’re winning
- Create superior content
- Consider paid backup
Quadrant 4: Battleground (Both Strong)
- Strategy: Differentiate or partner
- Actions:
- Find unique angle
- Target sub-niches
- Monitor closely
- Prepare for share battles
Step-by-Step Gap Analysis Process
Step 1: Identify Key Competitors
List your top 3-5 competitors by category.
Step 2: Export Keyword Rankings
Use your SoS tool to export rankings for:
- Your brand
- Each competitor
Step 3: Create Gap Analysis Table
| Keyword | Your Rank | Competitor A Rank | Gap | Opportunity |
| “vitamin C serum” | 12 | 3 | -9 | HIGH (competitor strong) |
| “brightening serum” | 5 | 8 | +3 | LOW (you lead) |
| “antioxidant serum” | 15 | 22 | +7 | MEDIUM (both weak) |
| “serum for dark spots” | 8 | 7 | -1 | HIGH (battleground) |
Step 4: Classify by Quadrant
| Keyword | Your Rank | Competitor Rank | Quadrant | Priority |
| “vitamin C serum” | Weak (12) | Strong (3) | Threat (Q3) | URGENT |
| “brightening serum” | Strong (5) | Weak (8) | Defend (Q1) | MEDIUM |
| “antioxidant serum” | Weak (15) | Weak (22) | Opportunity (Q2) | HIGH |
| “serum for dark spots” | Strong (8) | Strong (7) | Battleground (Q4) | MEDIUM |
Step 5: Identify “Why” Behind Gaps
For each high-priority gap, investigate:
| Factor | Questions | Data Source |
| Content Quality | Is competitor content more comprehensive? | Manual review |
| Page Authority | Do they have more backlinks? | SEO tools |
| User Experience | Is their page faster/better? | Site audit |
| Keyword Targeting | Are they optimizing better? | On-page analysis |
| Product Offering | Do they have better products? | Product comparison |
Step 6: Develop Attack Plan
For Opportunity Quadrant (Q2) keywords:
- Create comprehensive content
- Optimize on-page elements
- Build internal links
- Target within 3 months
For Threat Quadrant (Q3) keywords:
- Audit competitor content
- Create superior version
- Build authority signals
- Consider paid backup
- Target within 1 month
For Battleground Quadrant (Q4) keywords:
- Find unique angle
- Target sub-niches
- Monitor weekly
- Long-term focus
Gap Analysis Template
| Keyword | Your Rank | Comp Rank | Quadrant | Priority | Action | Owner | Timeline |
| “sunscreen SPF 50” | 8 | 2 | Threat | HIGH | Create buying guide | Content | Q2 |
| “reef safe sunscreen” | 4 | 9 | Defend | MEDIUM | Update post | SEO | Q2 |
| “mineral sunscreen” | 12 | 15 | Opportunity | HIGH | New category page | Content | Q1 |
| “sunscreen for face” | 5 | 4 | Battleground | MEDIUM | Video tutorial | Video | Q3 |
Measuring Gap Closure
Track progress monthly:
| Metric | Baseline | Month 1 | Month 2 | Month 3 | Target |
| Keyword Rank | 12 | 10 | 8 | 6 | 5 |
| Traffic | 500 | 650 | 800 | 1,000 | 1,200 |
| Share of Search | 8% | 10% | 12% | 14% | 15% |
How 42Signals Tracks Share of Search Across Amazon, Google, and Marketplace Platforms
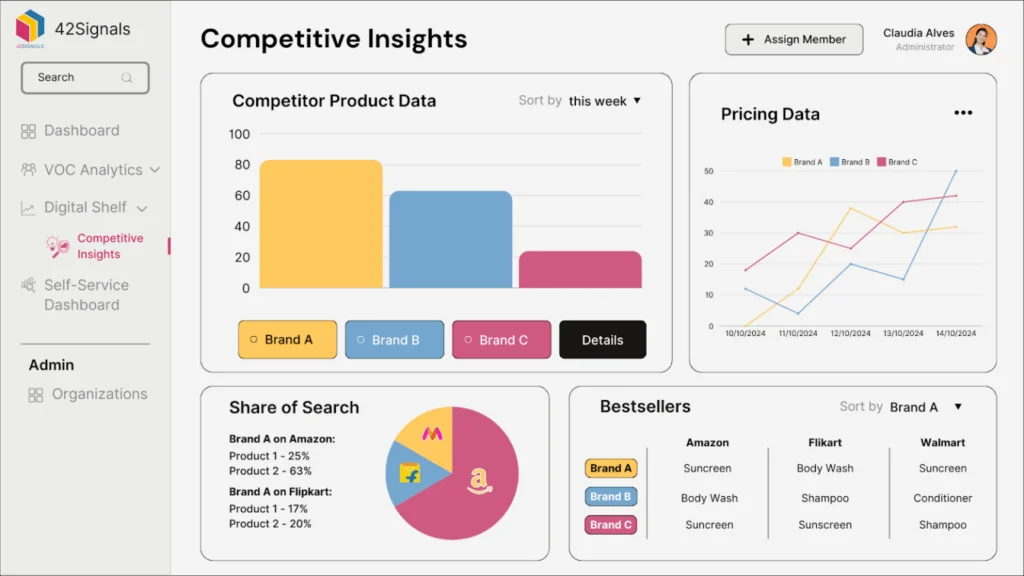
42Signals is a cutting-edge digital shelf analytics tool that enables brands to track their Share of Search across various channels and platforms. Here’s how it can help:
1. Multi-Platform Monitoring
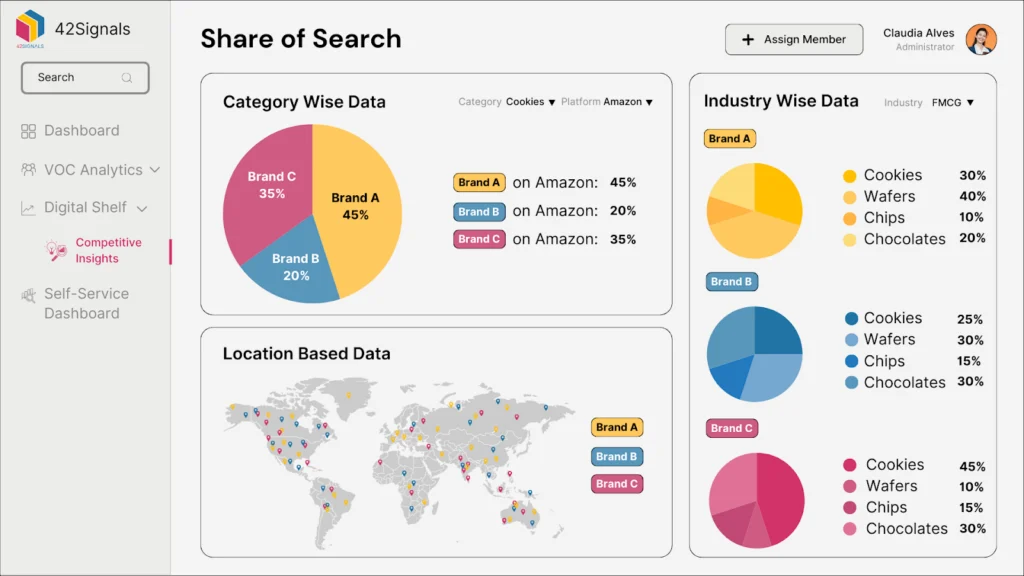
A brand’s presence isn’t confined to one channel. 42Signals provides unified insights into your brand’s search performance across all critical e-commerce platforms like Amazon, Flipkart, Walmart, and more, all from a single dashboard. This holistic view is crucial, as consumer behavior and competitive dynamics can vary significantly from platform to platform.
2. Competitor Analysis
The tool allows you to define and track a specific set of competitors for each product category. It goes beyond just showing who ranks #1. It reveals the entire landscape: which competitors are consistently appearing on the first page, which are gaining traction for which keywords, and how their Share of Search fluctuates over time. This allows for incredibly informed strategic decisions regarding product positioning, pricing, and promotional strategies.
3. Data-Driven Decisions
42Signals delivers real-time, accurate data on keyword rankings and search visibility. This empowers teams to move away from gut-feel decisions. For example, the data can inform:
Inventory & Forecasting: A rising Share of Search is a leading indicator of rising demand, allowing for better inventory planning especially with stock availability analytics.
SEO Strategy: Double down on keywords where you are on the cusp of page one.
PPC Strategy: Identify high-opportunity keywords where competitors have organic dominance, suggesting a potential paid opportunity to steal visibility.
Content Strategy: Create content tailored to keywords with high search volume but low competition.
4. Actionable Insights
The tool offers actionable ecommerce insights and recommendations on how to improve your share of search, optimize your keyword strategy, and ultimately increase your market presence.
Case Study: How a Skincare Brand Used Share of Search to Diagnose a Sales Drop
Let’s say you have a skincare brand whose highest-selling product is sunscreen. While it has been the bestseller for long, in the past couple of months you have seen your sales drop while your competitor’s sales are on the rise!
One of the reasons for this could be because each time a customer looks for sunscreen on an e-commerce platform such as Amazon, the products that show up at the top are those of your competitors instead of yours.
Without 42Signals: You notice the sales dip. You might guess it’s due to competition but have no concrete data. You might manually search for “sunscreen” and see a competitor’s ad. You then decide to increase your ad spend, a costly and reactive move that doesn’t address the root cause—your weak organic visibility.
With 42Signals: You receive an alert that your Share of Search for the core term “sunscreen” has dropped by 40% in three weeks. The tool identifies that two key competitors have overtaken you. Drilling down, you discover they have both begun ranking for new emerging terms like “blue light protection sunscreen” and “sunscreen with niacinamide.” You also see your product listing is missing these keywords and has a weaker conversion rate than your competitors’.
Your Action: You don’t just blindly spend more on ads. You:
- Optimize your product listing to include these high-value, emerging keywords.
- Create a new blog post and video content about the benefits of niacinamide in sun protection, building topical authority.
- Brief your product development team on this trend for future formulations.
- Launch a targeted PPC campaign on these specific terms to capture immediate intent while you rebuild your organic rank.
This is a strategic, data-driven, and multi-faceted response that addresses the immediate problem and builds long-term resilience.
With 42Signals, you can stay ahead of the competition by continuously monitoring and refining your keyword strategy based on real-time data.
Conclusion on Share of Search Tool
Understanding and optimizing your Share of Search is crucial for maintaining and enhancing your brand’s visibility in a competitive digital landscape. Keywords play a pivotal role in this process, acting as the gateway to capturing your audience’s attention and outperforming your competitors.
By keeping track of your competitors’ keyword strategies and leveraging advanced tools like 42Signals, you can stay ahead of the curve and dominate your share of search.
Want to replicate this kind of analysis for your own category? 42Signals tracks Share of Search across Amazon, Flipkart, Google, and Walmart in a single dashboard — with automated alerts when competitor visibility changes. Book a personalised demo and we’ll run a live gap analysis of your competitive set.
Frequently Asked Questions
What is an example of a share of search?
An example of Share of Search would be comparing the number of Google searches for “Nike” against other athletic shoe brands like “Adidas,” “Puma,” and “Reebok” over a specific period.
Let’s say:
“Nike” had 50,000 searches
“Adidas” had 30,000
“Puma” had 15,000
“Reebok” had 5,000
The total searches for this category = 100,000.
Nike’s Share of Search = (50,000 / 100,000) × 100 = 50%
This means half of all brand-related searches in the category were for Nike—indicating stronger interest or awareness in the digital space.
What is the difference between SoS and SOV?
Though Share of Search (SoS) and Share of Voice (SOV) are both brand visibility metrics, they focus on different things:
SoS is based on how frequently a brand is searched for online relative to competitors. It reflects organic consumer interest, often before a purchase decision.
SOV typically measures a brand’s presence in paid media—how much advertising share it holds compared to others. It can apply to digital ads, TV, radio, or social media campaigns.
In short:
SOV = paid or earned exposure
SoS = consumer-driven interest (search intent)
SoS is increasingly seen as a leading indicator of brand health, especially in digital markets.
How do you calculate the share of search?
To calculate Share of Search:
Step 1: Identify the main brands in your category.
Step 2: Use tools like Google Trends, Ahrefs, or SEMrush to get monthly search volumes for each brand.
Step 3: Add up the total search volume for all brands in the category.
Step 4: Apply the formula:
Share of Search (%) = (Your Brand’s Search Volume ÷ Total Search Volume) × 100
For example, if your brand has 20,000 searches out of a total of 100,000, your Share of Search is 20%.
What is search share?
Search Share, often used interchangeably with Share of Search, refers to the percentage of total search traffic that a brand or product receives within a specific industry or keyword category. It helps marketers understand how visible or top-of-mind a brand is when consumers search for related topics online.
Unlike website traffic or ad impressions, search share reflects direct consumer intent and can serve as a proxy for market interest, awareness, or brand momentum—especially when tracked over time.