Price and Availability: The Two Variables That Determine Whether You Win or Lose the Sale
Price and availability are not independent levers — they are a single system. When stock runs low, pricing power increases. When competitors go out of stock, your opportunity window opens. When you go out of stock, you lose not just immediate sales but search rank, Buy Box ownership, and customer trust that takes weeks to rebuild. This guide covers the full interplay between the two: how to detect and manage price parity breaks across 1P and 3P channels, how to quantify the true cascading cost of a stockout, how to use the Price vs. Availability Decision Matrix for rapid, consistent responses, and how to build a lost sales model that turns inventory decisions into a CFO-ready business case.
In ecommerce, price and availability are not two separate decisions — they are one system. Your pricing power at any moment is a direct function of how much stock you have, what your competitors have, and whether your marketplace position is stable or recovering from a stockout. Get this interplay wrong and you lose the sale twice: once when you’re out of stock, and again when you discount to recover the rank you lost while you were gone
Who This Article Is For: Mastering Price and Availability
This deep dive into the interplay between price and availability is specifically designed for the professionals who manage these dynamics every day. If you fall into any of these categories, the following sections are your essential playbook:
| Role | Primary Focus | What You’ll Gain |
| Ecommerce Operations Managers | Day-to-day management of online channels | Frameworks for balancing stock levels with pricing decisions to maximize revenue and minimize stockout impact |
| Category Managers / Merchandisers | Product assortment and profitability | Insights on how availability signals should inform pricing strategy and promotional planning |
| Marketplace Sellers | Selling on Amazon, Walmart, eBay, etc. | Understanding how stockouts affect Buy Box ownership, search rank, and competitive positioning |
| Pricing Strategists | Setting and optimizing prices | Models for stock-aware pricing that protect margins while maintaining competitiveness |
| Supply Chain Planners | Inventory management and forecasting | Visibility into how stock levels directly impact revenue, not just costs |
| Brand Owners / Founders | Overall business strategy | Holistic view of how price and availability together drive customer trust and long-term brand value |
Whether you’re managing thousands of SKUs across multiple marketplaces or fine-tuning inventory for a growing brand, this guide provides the frameworks and insights you need to make data-driven decisions that balance price competitiveness with stock availability.
Stock availability refers to the presence or absence of products for consumer purchase. Its level can significantly impact both the supply side and demand side of the market. When stock is abundant, customers have more options, leading to a competitive environment where businesses strive to attract buyers through appealing pricing. On the other hand, limited stock can create a sense of urgency among consumers, often leading to an increase in prices. That’s the dance between price and availability and why it’s so important.
In any marketplace, the availability of products is central to the shopping experience. Whether online or in physical stores, consumers expect to find what they need without undue hassle.
When items are readily available, buyers are more likely to shop at their preferred retailers, knowing they won’t leave empty-handed.
In contrast, if certain products are often out of stock, customers might turn to competitors or alternative goods, sometimes even abandoning their purchases altogether.
For businesses, this means that stock management isn’t just about meeting demand; it’s about maintaining a relationship of trust with consumers.
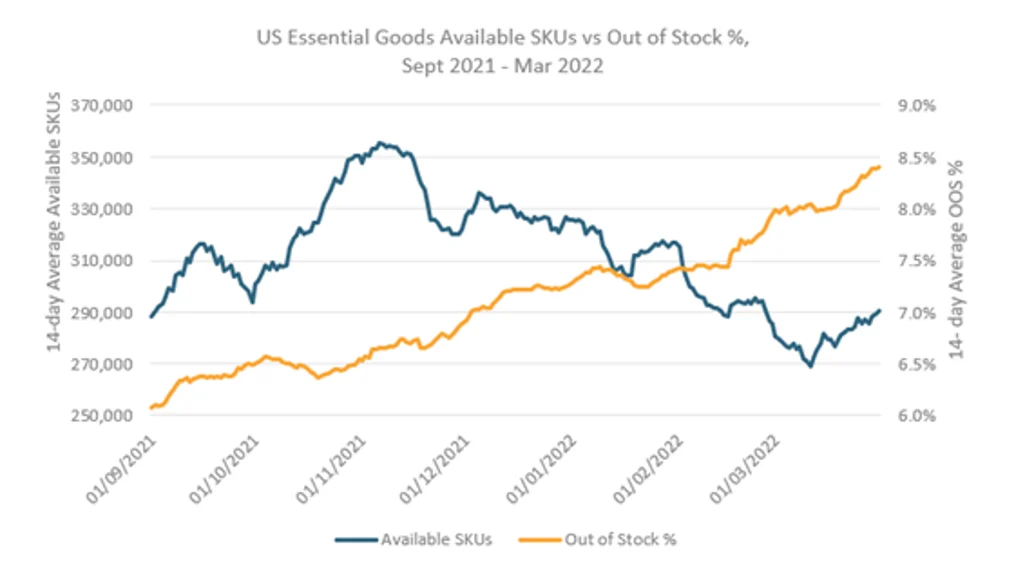
Image Source: Euromonitor
How Stock Levels Drive Pricing Decisions: The Fundamental Relationship
The close relationship between price and availability is essential for understanding how markets work.
The more stock a company has, the more likely it is to lower prices to move products. This could be due to several factors, including the need to clear out older items to make space for new inventory, or simply because the cost of storing large quantities of products becomes too high.
For example, when a new version of a smartphone is released, retailers often reduce the prices of older models to clear stock and avoid potential losses from unsold goods.
Conversely, when stock is low, businesses might increase prices, capitalizing on the higher demand for hard-to-find items. In these situations, customers may be willing to pay more because they perceive the product as being scarce, which increases its perceived value.
The phenomenon of stock availability affecting pricing is not new. However, it has gained more visibility in recent years due to global supply chain issues and the rise of e-commerce, making price and availability a larger concern.
Online retailers often have dynamic pricing models that adjust in real time based on inventory levels. For example, popular products like gaming consoles, smartphones, or seasonal items can see significant price hikes when stock is limited, while they may be discounted heavily when supply is abundant.
Price Parity Refresh: What It Means Across 1P vs. 3P Channels
Price parity across channels —maintaining consistent pricing across different sales channels—has become increasingly complex in today’s multi-channel ecommerce landscape. Understanding how parity works (and breaks) across first-party (1P) and third-party (3P) channels is essential for brand protection.
Defining 1P vs. 3P Channels
| Channel Type | Description | Examples | Who Sets Price |
| 1P (First-Party) | Brand sells directly to retailer, who then sells to consumer | Amazon Vendor Central, Walmart Direct, Target | Retailer (with brand input) |
| 3P (Third-Party) | Brand or authorized sellers list directly on marketplace | Amazon Seller Central, eBay, Walmart Marketplace | Seller (brand or reseller) |
| DTC (Direct-to-Consumer) | Brand owns the channel completely | Your own website (Shopify, Magento, etc.) | Brand |
Why Price Parity Breaks
1. Channel-Specific Costs
Different channels have different cost structures, which naturally create pressure for price variation:
| Channel | Cost Factors | Pricing Pressure |
| DTC Website | Platform fees, payment processing, marketing | Higher margin, more control |
| Amazon 1P | Wholesale discounts, co-op fees | Brand sells at wholesale; retailer sets retail |
| Amazon 3P | Referral fees (8-15%), FBA fees | Sellers need to cover fees |
| Physical Retail | Rent, staff, utilities | Higher overhead = higher price needed |
2. Promotional Timing
Different channels run promotions at different times:
- Amazon Prime Day (July)
- Walmart Deals (March, October)
- Target Circle Week (quarterly)
- Brand-site specific sales
When one channel runs a promotion and others don’t, price parity breaks temporarily.
3. Inventory-Driven Pricing
As discussed earlier, stock levels influence pricing. When one channel has excess inventory and another has limited stock, prices naturally diverge.
4. Unauthorized Sellers
The biggest threat to price parity is unauthorized 3P sellers who:
- Source products through gray market channels
- Have lower overhead (no marketing costs, no customer service)
- Can undercut authorized channels significantly
- Don’t care about long-term brand equity
How to Detect Price Parity Breaks
Manual Detection (Limited)
- Weekly price checks across key channels
- Spreadsheet tracking of top SKUs
- Customer complaints about price discrepancies
Automated Detection (Recommended)
Using tools like 42Signals, you can:
- Monitor prices across all channels in real-time with competitor price monitoring
- Set alert thresholds for price gaps (e.g., “alert if 3P price < DTC price by 10%”)
- Track parity trends over time
- Identify problematic sellers or channels
Parity Alert Example:
Alert: Price parity break detected
SKU: XYZ-123 (Premium Blender)
DTC Price: $129.99
Amazon 3P Price: $99.99
Gap: -23%
Seller: “discountdeals_123” (Unauthorized)
Recommended Action: Investigate source; send cease & desist
Managing Price Parity Across Channels
| Scenario | Recommended Approach |
| Authorized 1P vs. DTC | Maintain strict parity; coordinate promotions |
| Authorized 3P vs. DTC | Set MAP policy; enforce consistently |
| Unauthorized 3P | Zero tolerance; remove from market |
| Temporary Promotions | Communicate timing across channels; parity returns post-promo |
| Geographic Differences | Accept regional variation; maintain within-region parity |
How Stock Imbalances Break Price Parity Across Channels — and How to Fix It
The relationship between stock availability and price parity is more complex than it might seem at first glance.
At first, one might question why stock levels would affect price parity, or how these two concepts are connected.
The connection lies in the way businesses manage their inventory and set prices across different sales channels.
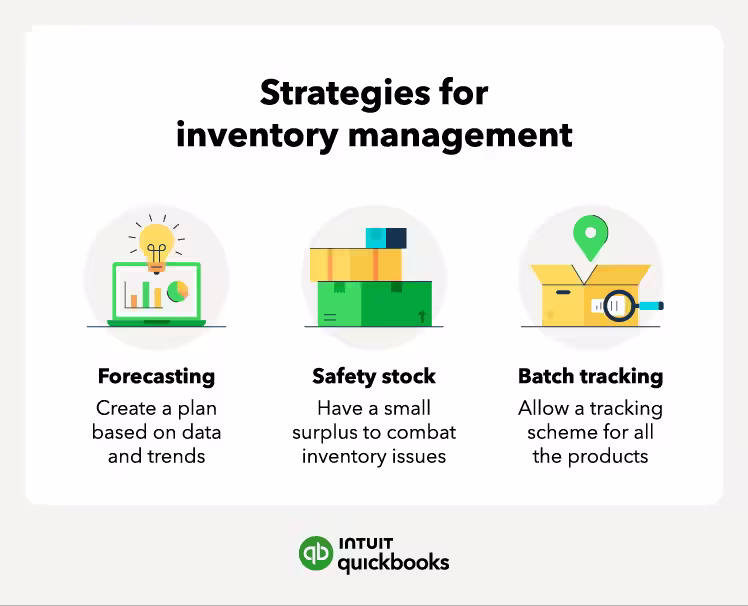
Image Source: Quick Books
Stock availability can have a significant impact on how a company implements its price parity strategy, particularly when stock levels differ between online and physical stores or between different regions.
When There’s Lots of Stock:
When a company has ample stock, it may lower prices to move inventory more quickly.
This is especially true when the company needs to clear space for new products or when it’s dealing with perishable goods that have a limited shelf life.
For example, during clearance sales or end-of-season sales, businesses often reduce prices significantly to sell off excess inventory.
In such cases, price parity might be temporarily adjusted to reflect the lower prices, but businesses must be careful to ensure that the discounts are applied consistently across all sales channels.
When There’s Not Much Stock:
On the other hand, when stock levels are low, prices may increase as a result of higher demand and limited availability.
This was evident during the COVID-19 pandemic when certain products, such as face masks, hand sanitizers, and cleaning supplies, became scarce due to increased demand.
As a result, prices for these items surged, especially in markets where stock was extremely limited.
In these cases, maintaining price parity can be challenging, as online and physical stores may have different stock levels, leading to price discrepancies.
What About Sales Online and In Stores?
One of the most significant challenges for businesses in maintaining price and availability is managing price differences between online and physical stores.
Stock levels can vary significantly between these two sales channels, often leading to price differences. For example, if an online retailer has a large amount of stock, it may offer lower prices to encourage customers to buy.
In contrast, a physical store with limited stock may need to charge higher prices due to higher operational costs, such as rent and utilities.
The difference in warehousing costs versus the cost of maintaining a physical storefront is another factor that can influence pricing.
Renting a space in a high-traffic mall or shopping district can be expensive, and businesses operating in these areas may need to charge higher prices to cover their overheads.
In contrast, an online retailer with lower warehousing costs may have more flexibility to lower prices without sacrificing profit margins.
Laws and Rules:
In some cases, businesses are restricted by laws and regulations that prevent them from changing prices too drastically, especially during times of crisis or when certain products are in short supply.
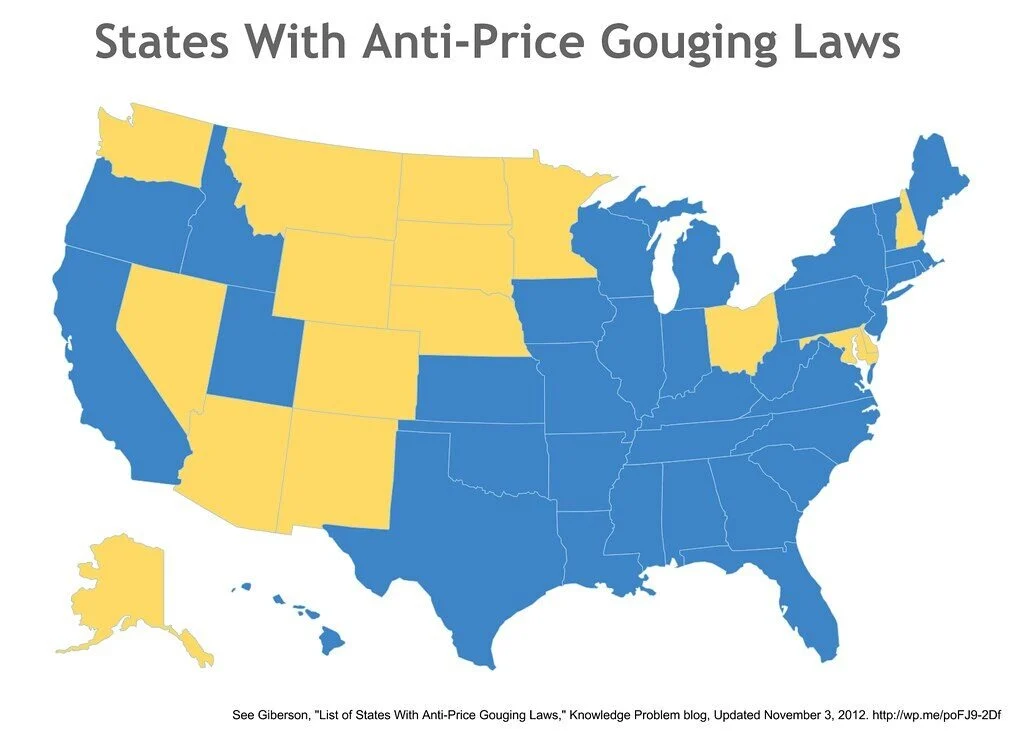
Image Source: Knowledge Problem
For example, many countries have laws that prohibit price gouging during emergencies, which can limit how much businesses can raise prices when stock is low. These rules are designed to protect consumers from unfair pricing practices and ensure that essential goods remain affordable.
MAP violations are one such rule where distributors cannot lower prices below the agreed-upon amount with the manufacturer which can be detected with a MAP monitoring software. It destroys brand trust and if continued can also lead to bad relations with the brand.
Stock-Out Impact on Pricing: The Hidden Cost of Empty Shelves
When a SKU goes out of stock, the damage extends far beyond lost sales during the outage period. Stockouts create cascading effects on your pricing power and competitive position.
The Stock-Out Cascade
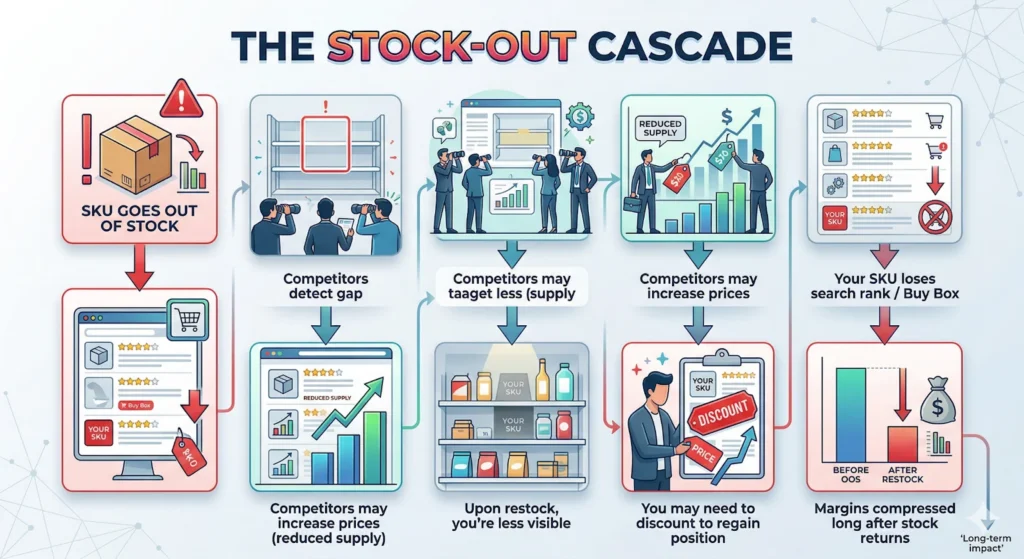
What Happens to Price Competitiveness During Stockouts
1. Competitor Repricing
When your SKU is unavailable, competitors with inventory face reduced competition. Smart competitors will:
- Monitor your stock status (many use automated tools)
- Increase prices when you’re out of stock
- Capture the margin you left on the table
Real Example:
| Scenario | Your Price | Competitor Price Before | Competitor Price During Your Stockout |
| In Stock | $49.99 | $47.99 | $47.99 |
| You OOS | N/A | $47.99 | $54.99 (+15%) |
Result: Competitor captures 15% higher margin on sales that would have gone to you.
2. Buy Box Loss on Marketplaces
On platforms like Amazon, the Buy Box is awarded based on multiple factors including price and availability. When you’re out of stock:
- You automatically lose Buy Box eligibility
- Competitor with inventory wins Buy Box
- Even after restock, it takes time to regain Buy Box
- You may need to price lower than competitor to win it back with competitor price intelligence
3. Marketplace Search Rank Drop
Marketplaces prioritize in-stock items in search results. When you’re out of stock:
- Your rank drops (sometimes dramatically)
- Upon restock, you rank lower than before, you can get this data with share of search analytics
- Lower rank = less visibility = fewer sales
- You may need to discount to recover rank
Amazon Search Rank Impact Study:
| Period | Rank | Price | Status |
| Week 1-4 | #8 | $49.99 | In Stock |
| Week 5 | #12 | $49.99 | Out of Stock |
| Week 6 | #25 | $49.99 | Out of Stock |
| Week 7 (Restock) | #22 | $49.99 | In Stock |
| Week 8 | #18 | $47.99 | In Stock (discounted to recover) |
Key Insight: It took a 4% price discount and 3 weeks to return to pre-stockout rank.
4. Customer Switching
When customers encounter a stockout:
- 73% will buy from a competitor (source: IHL Group)
- 45% will never return to your brand
- Those who return may expect discounts (they now perceive you as less reliable)
Quantifying Stock-Out Impact
Short-Term Impact:
Lost revenue during outage = (Days OOS × Average Daily Units × Price)
Medium-Term Impact:
- Discount needed to recover rank
- Weeks of lower conversion rates
- Competitor margin gains at your expense
Long-Term Impact:
- Permanent customer loss
- Brand perception damage
- Weakened negotiating position with retailers
First-Party vs. Marketplace Availability: Why They Must Be Tracked Separately
Availability data from your own site and from marketplace listings tell different stories and require different tracking approaches.
Key Differences
| Aspect | First-Party (Your Site) | Marketplace (Amazon, Walmart, etc.) |
| Who Controls Stock | You (direct) | Seller (you or third party) |
| Data Access | Complete (your system) | Limited (API or scraping) |
| Update Speed | Real-time | Variable (may lag) |
| Out-of-Stock Reasons | Your inventory only | Seller inventory, account issues, suspensions |
| Recovery Control | Full | Limited (platform rules) |
Why You Need Both Views
Your Site Availability Tells You:
- Actual inventory status
- Fulfillment capacity
- Demand relative to forecast
Marketplace Availability Tells You:
- Competitor stock status (opportunity!)
- Authorized seller compliance
- Unauthorized seller activity
- Platform-specific supply issues
The Competitive Intelligence Opportunity
When you track marketplace availability, you gain critical intelligence:
| Signal | What It Means | Action |
| Competitor out of stock | Supply gap you can fill | Maintain or increase price; promote availability |
| Competitor restock | Supply returning | Monitor for price drops; adjust if needed |
| New seller appears | Potential unauthorized source | Investigate; send warning |
| Seller disappears | Possible suspension or exit | Watch for inventory liquidation |
Tracking Methods
| Method | Pros | Cons | Best For |
| Manual Check | Free | Time-consuming, error-prone | Small catalogs, occasional checks |
| Marketplace APIs | Real-time, accurate | Limited to 1P sellers, not 3P | 1P vendors |
| Web Scraping Tools | Comprehensive, automated | Technical setup required | 3P monitoring |
| Specialized Platforms | Turnkey, multi-channel stock availability analytics | Cost | Professional brands (recommended) |
Lost Sales Model: Quantifying the Impact of Stockouts
One of the most powerful business cases you can build is quantifying the revenue lost to stockouts with ecommerce market intelligence. This model helps prioritize restocking vs. repricing decisions.
The Basic Lost Sales Formula
Estimated Lost Revenue = (Days Out of Stock × Average Daily Units × Selling Price)
Example:
- Product: Premium Blender ($129.99)
- Average daily units: 15
- Days out of stock: 7
- Lost revenue = 7 × 15 × $129.99 = $13,649
The Refined Model (Adding Complexity)
For more accuracy, incorporate these factors:
1. Seasonal Adjustment
Multiply by seasonal index (e.g., 1.5 during holiday peak)
2. Substitution Rate
Not all lost sales are permanent. Some customers buy different products from you.
True Lost Sales = Days OOS × Average Daily Units × (1 – Substitution Rate) × Price
If 30% of customers buy a different product from you:
- True lost sales = 7 × 15 × (1 – 0.3) × $129.99 = $9,554
3. Margin Impact
Convert lost revenue to lost profit:
Lost Profit = Lost Revenue × Gross Margin %
If margin is 40%:
- Lost profit = $13,649 × 0.40 = $5,460
4. Customer Lifetime Value Impact
For every customer lost permanently, you lose future revenue:
Long-Term Loss = Lost Customers × Average CLV
If each stockout loses 10 customers with $500 CLV:
- Long-term loss = 10 × $500 = $5,000
Total Stockout Cost Model
| Component | Calculation | Example Value |
| Immediate Lost Revenue | Days OOS × Daily Units × Price | $13,649 |
| Substitution Adjustment | Subtract sales captured elsewhere | -$4,095 |
| Net Immediate Lost Sales | $9,554 | |
| Gross Margin % | 40% | |
| Immediate Lost Profit | $3,822 | |
| Customer Acquisition Cost to Replace | Lost customers × CAC | $2,500 |
| Future CLV Lost | Lost customers × CLV | $5,000 |
| Rank Recovery Cost | Discounts needed | $1,500 |
| Total Stockout Cost | $12,822 |
Ready to track price and availability together in one dashboard? 42Signals monitors stock status and competitor pricing across Amazon, Walmart, Flipkart, and your own channels in real time — alerting you the moment a stockout or price parity break occurs. Book a demo and we’ll show you the Decision Matrix in action for your specific category
Using This Model for Decisions
Scenario A: Restock vs. Reprice
You have limited inventory arriving. You could:
- Option 1: Sell at current price, stock will last 2 weeks
- Option 2: Increase price 15%, stock lasts 3 weeks
| Metric | Option 1 | Option 2 |
| Units Sold | 210 | 180 |
| Price | $100 | $115 |
| Revenue | $21,000 | $20,700 |
| Margin (50%) | $10,500 | $10,350 |
| Profit | $10,500 | $10,350 |
Decision: Option 1 generates slightly more profit, but Option 2 avoids stockout 1 week earlier. If stockout cost is high, Option 2 may be better despite lower revenue.
Scenario B: Invest in Inventory
Your lost sales model shows frequent stockouts costing $50,000 annually. Investing $30,000 in additional safety stock eliminates 80% of stockouts which can be done with inventory forecasting.
| Metric | Without Investment | With Investment |
| Annual Stockout Cost | $50,000 | $10,000 |
| Inventory Investment | $0 | $30,000 |
| Carrying Cost (20%) | $0 | $6,000 |
| Net Cost | $50,000 | $16,000 |
ROI: $34,000 annual savings = 113% return on inventory investment.
Price vs. Availability Decision Matrix
Use this 2×2 framework to make rapid, consistent decisions when faced with different price and availability scenarios.
The Matrix
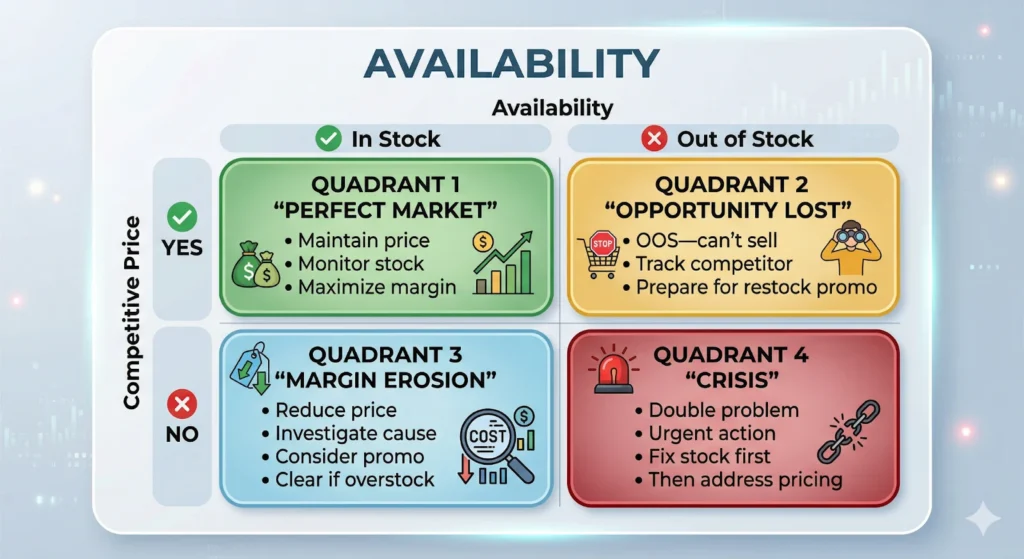
Quadrant-by-Quadrant Actions
Quadrant 1: Perfect Market (In Stock + Competitive Price)
- Situation: You have inventory and your price is competitive
- Goal: Maximize revenue while maintaining position
- Actions:
- Maintain current price
- Monitor stock levels closely
- Consider slight price increases if demand outpaces supply
- Use as traffic driver for cross-sells
- Measure conversion rate as baseline
Quadrant 2: Opportunity Lost (Out of Stock + Competitive Price)
- Situation: You’d be winning if you had inventory, but you’re OOS
- Goal: Restock ASAP; minimize long-term damage
- Actions:
- Expedite restock (highest priority)
- Track competitor prices during your absence (they may increase)
- Prepare promotional campaign for restock announcement
- Capture email signups for “notify when available”
- Calculate lost sales for business case
Quadrant 3: Margin Erosion (In Stock + Uncompetitive Price)
- Situation: You have inventory but your price is too high vs. competitors
- Goal: Restore competitiveness without destroying margin
- Actions:
- Investigate why price is uncompetitive (cost increase? competitor promotion?)
- Consider targeted price reduction
- If overstock, accelerate with promotion
- If healthy stock, partial match competitor
- Add value messaging to justify premium (if brand supports it)
Quadrant 4: Crisis (Out of Stock + Uncompetitive Price)
- Situation: Worst of all worlds—no stock and uncompetitive pricing
- Goal: Emergency response
- Actions:
- Fix stock first (this is the primary problem)
- Investigate pricing issue (was it due to OOS rank drop?)
- Upon restock, plan aggressive recovery
- Expect to discount to regain position
- Root cause analysis: how did this happen?
Decision Priority by Quadrant
| Quadrant | Priority | Owner | Timeline |
| Q1: Perfect Market | Medium | Category Manager | Weekly review |
| Q2: Opportunity Lost | HIGH | Supply Chain | Immediate |
| Q3: Margin Erosion | Medium-High | Pricing Team | 24-48 hours |
| Q4: Crisis | CRITICAL | Leadership | Immediate |
When to Shift Strategies
| Signal | From Quadrant | To Quadrant | Action Trigger |
| Stock drops below threshold | Q1 → Q2 | Perfect → Opportunity Lost | Reorder triggered |
| Competitor drops price | Q1 → Q3 | Perfect → Margin Erosion | Price alert received |
| Restock arrives | Q2 → Q1 | Opportunity Lost → Perfect | Inventory updated |
| Price correction | Q3 → Q1 | Margin Erosion → Perfect | Price change executed |
| Stockout + price gap | Q3 → Q4 | Margin Erosion → Crisis | Both conditions true |
Conclusion on Price and Availability
The interplay between price and availability strategies is intricate and vital for business success.
With the above examples, it’s easy to understand how understocking and overstocking can impact the brand as well as the customer experience.
42Signals has the answer to this problem by providing timely information about product availability analytics to help brands sustain a seamless shopping experience for their customers.
Ready to track price and availability together in one dashboard? 42Signals monitors stock status and competitor pricing across Amazon, Walmart, Flipkart, and your own channels in real time — alerting you the moment a stockout or price parity break occurs. Book a demo and we’ll show you the Decision Matrix in action for your specific category.
Frequently Asked Questions
How does a stockout affect your price competitiveness on Amazon?
When your SKU goes out of stock, you immediately lose Buy Box eligibility and your search rank drops — sometimes dramatically. Upon restocking, you rank lower than before the outage, which means less visibility and fewer sales. To recover your position, you will typically need to price below your pre-stockout level, compressing margins for weeks after your inventory returns.
What is price parity and why does it break across 1P and 3P channels?
Price parity means maintaining consistent pricing across all sales channels. It breaks across first-party and third-party channels for four main reasons: different cost structures (referral fees, wholesale discounts), misaligned promotional timing, inventory-driven price variation when stock levels differ between channels, and unauthorized third-party sellers who source products through grey market channels and undercut authorized pricing without regard for brand equity.
How do you calculate the true cost of a stockout?
Start with immediate lost revenue: days out of stock multiplied by average daily units multiplied by selling price. Then apply a substitution adjustment for customers who buy an alternative from you, convert to lost profit using your gross margin percentage, add the cost of discounts needed to recover search rank, and finally add the long-term customer lifetime value lost to permanent switching. All four components together represent the true stockout cost.
What is the difference between first-party and third-party availability tracking?
First-party availability refers to stock status on your own website or direct channels, where you have complete, real-time visibility and full control over recovery. Third-party availability refers to stock status across marketplace listings — your own and competitors’ — where data access is limited and update speed varies. Tracking both is essential: your site tells you your inventory health, while marketplace data reveals competitor stockouts that represent immediate pricing and sales opportunities.
How should pricing change when a competitor goes out of stock?
When a competitor goes out of stock on a shared SKU, you face reduced competition and increased demand for your listing. The recommended response is to maintain or modestly increase your price to capture the higher margin the market will now support, while actively promoting your availability. Monitor the competitor’s restock timeline closely — when they return to stock, be prepared to adjust your price back down to maintain competitiveness.